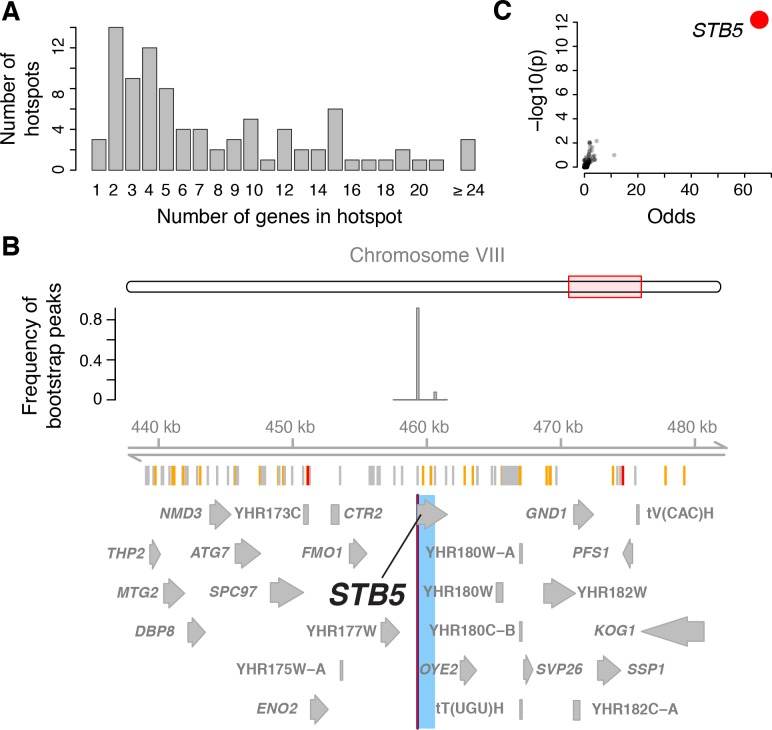
Figure 4. Genes located in hotspot regions.
(A) Histogram showing the number of genes located in the hotspot regions. (B) A hotspot on chromosome VIII maps to the gene STB5. From top to bottom: the general region on the chromosome, the empirical frequency distribution of hotspot peak locations from 1000 bootstrap samples (Materials and methods), locations of BY/RM sequence variants (red: variants with ‘high’ impact such as premature stop codons (McLaren et al., 2016); orange: ‘moderate’ impact such as nonsynonymous variants; grey: ‘low’ impact such as synonymous or intergenic variants), and gene locations. The light blue area shows the 95% confidence interval of the hotspot location as determined from the bootstraps. The red line shows the position of the most frequent bootstrap marker. (C) Genes for which the BY allele at the STB5 hotspot is linked to lower expression are enriched for STB5 transcription factor (TF) binding sites in their promoter regions. The figure shows enrichment results for all annotated TFs (grey dots), with the strength of enrichment (odds ratio) on the x-axis vs. significance of the enrichment on the y-axis. The STB5 result is highlighted in red.


