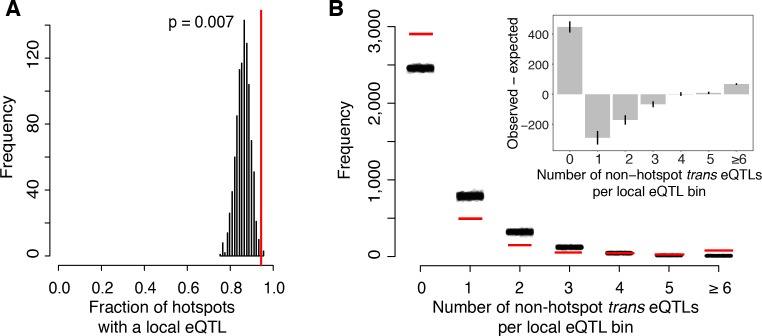
Figure 5. Relationship of local eQTLs and distant eQTL hotspots.
(A) The fraction of hotspots that contain a genome-wide significant local eQTL. The black histogram shows the distribution observed in 1000 random, size-matched regions of the genome. Because of the high number of local eQTLs, most hotspots are expected to contain a local eQTL even by chance. The observed fraction (red line) still exceeds this random expectation. (B) Distribution of trans eQTLs at local eQTLs outside of hotspot regions. The genome was divided into non-overlapping bins centered on local eQTLs that did not overlap a hotspot. We counted the number of trans-eQTL peaks in each bin. The figure shows the frequency of bins with a given number of trans-eQTLs. The distribution observed in real data is shown by red lines, and distributions obtained in 1000 randomizations of trans-eQTL positions is show by clouds of black circles. The inset shows the observed less the expected frequency for each bin. Error bars indicate the 95% range from the randomizations.

