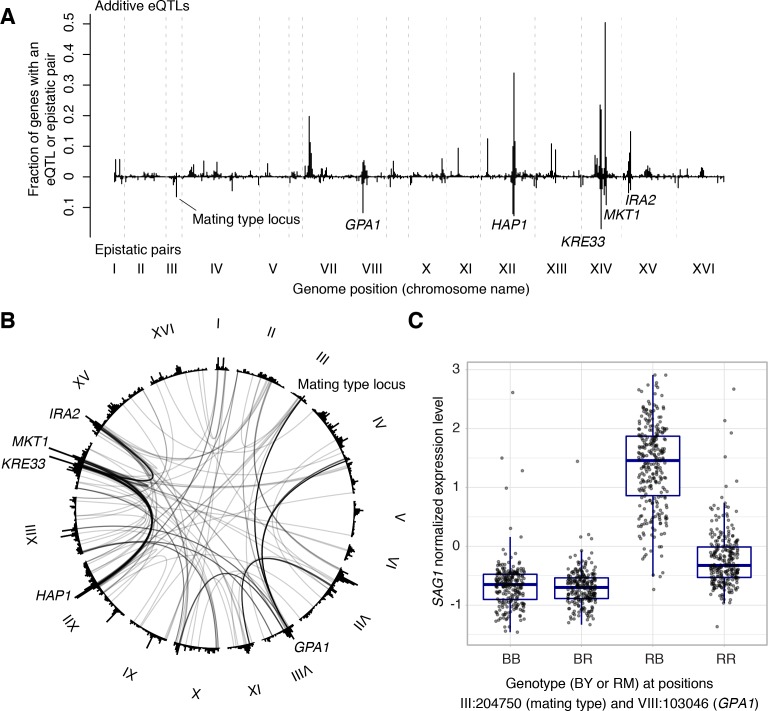
Figure 7. Non-additive interactions between eQTLs.
(A) Locations of markers of epistatic pairs (pointing downward) compared to those of additive eQTLs (pointing upward). Epistatic hotspots discussed in the text are highlighted. (B) Interactions between two trans loci. The plot shows the genome broken up into chromosomes (indicated as roman numerals), with arches connecting two interacting loci. Arches are shaded such that multiple overlapping interactions appear darker. Epistatic hotspots are indicated as in panel A. The outer histogram shows the density of additive eQTLs. (C) Expression levels of SAG1 as a function of genotypes at the mating type locus and GPA1.
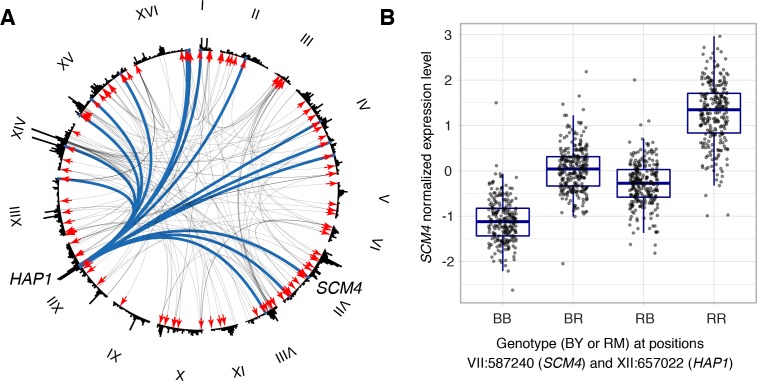
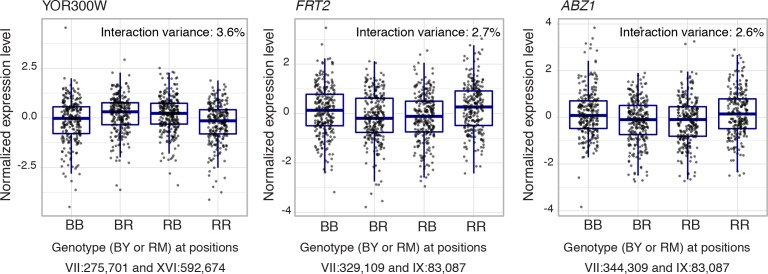
Figure 7—figure supplement 1. Cis by trans interactions.
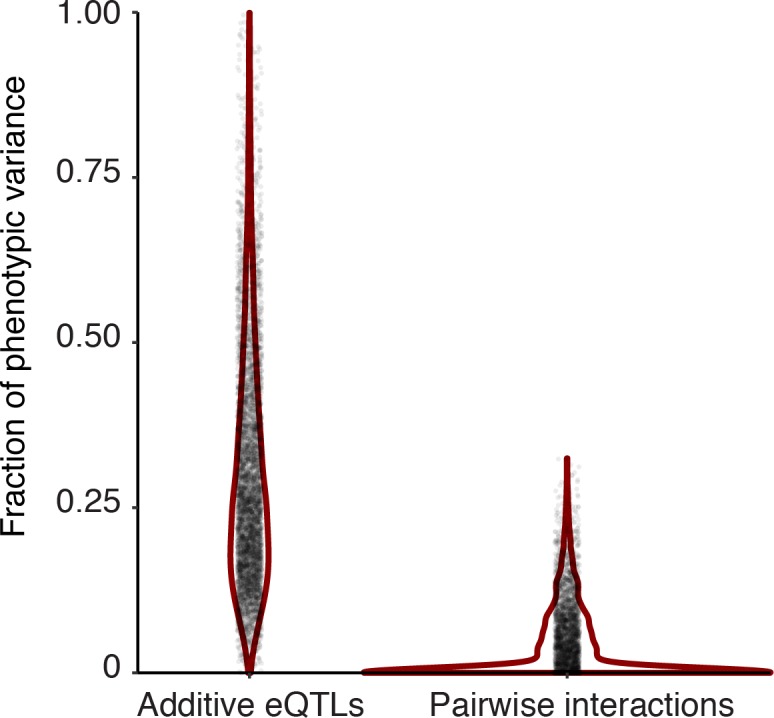
Figure 7—figure supplement 2. Distribution of the fraction of phenotypic variance (y-axis) explained by genetic variation as captured by genome-wide relatedness in an additive (left), and interactive (right) model.


