. 2018 Feb 26;9(5):783–788. doi: 10.1039/c8md00010g

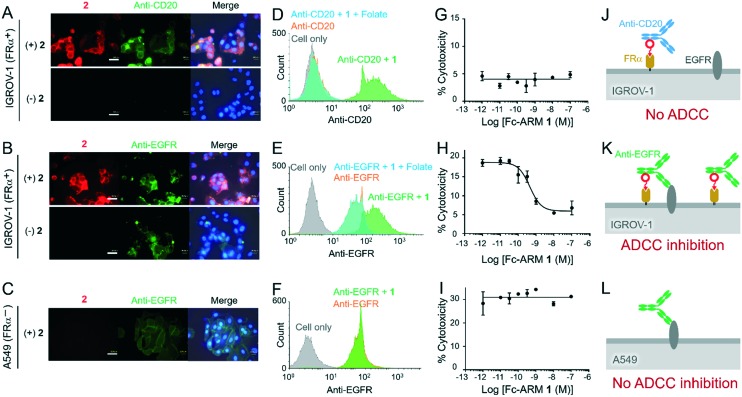
Fig. 3. Accumulation of mAbs on the surface of IGROV-1 and A549 cells was evaluated by fluorescence microscopy (A–C) and flow cytometry (D–F). ADCC inhibition by Fc-ARM was evaluated (G–I). Schematic representation of expected complexes existing on the cell surface (J–L). IGROV-1 was treated with anti-CD mAbs (A, D, G and J) or anti-EGFR mAbs (B, E, H and K), respectively. A549 was treated with anti-EGFR mAbs (C, F, I and L). In the evaluation of ADCC, IGROV-1 cells were treated with various concentrations of Fc-ARM 1 in the presence of 100 nM anti-CD20 mAbs (G) or anti-EGFR mAbs (H) and then mixed with NK cells (effector : target ratio = 8 : 1). A549 cells were treated similarly using the anti-EGFR mAbs (I). Cytotoxicity was calculated by quantitating the amount of LDH released from the targets (n = 3, mean ± SD). The concentrations of Fc-ARM and mAbs are 100 nM and 500 nM under microscopic observation (A–C) and 10 nM and 100 nM in flow cytometry (D–F), respectively. Nuclei were stained using Hoechst33342. Scale bars in the microscopy images are 40 μm.

Fig. 3