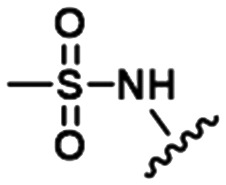
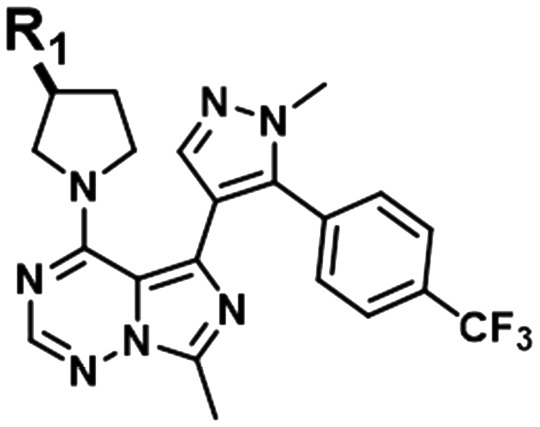
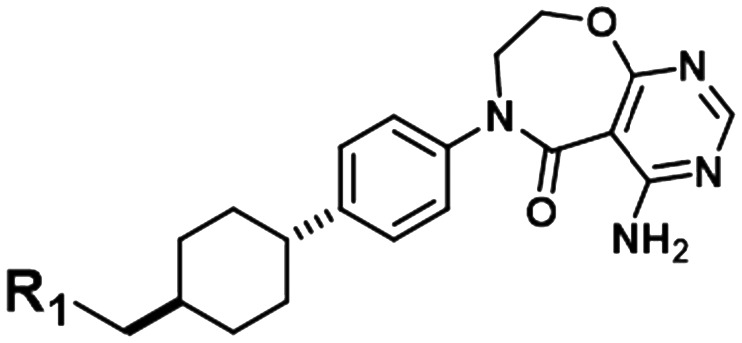
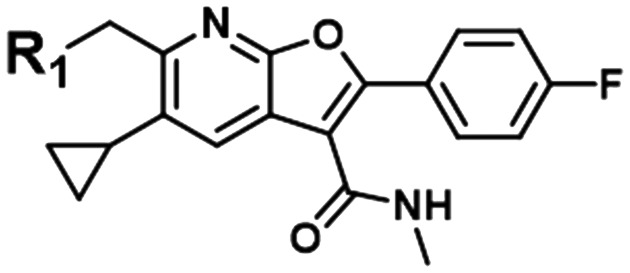
Table 1. Examples of matched molecular series (MMS) with associated pIC50 data in PDE2A (1), DGAT1 (2), and HCV (3).
| Core | Assay |
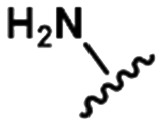
|
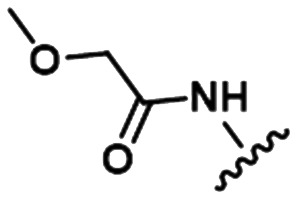
|
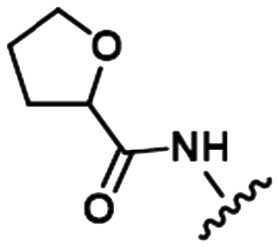
|
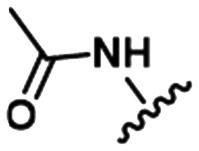
|
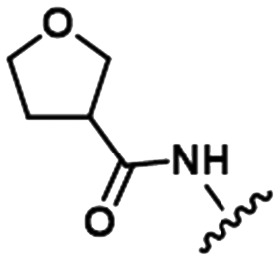
|
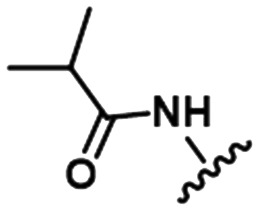
|
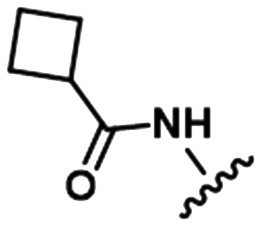
|
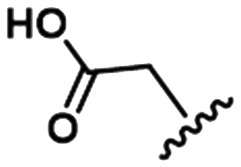
|
|
|
| 1 |
|
PDE2A | 7.5 | 8.0 | 8.1 | 8.3 | 8.4 | 8.5 | 8.5 | 8.7 | 8.8 |
| 2 |
|
DGAT1 | 6.7 | 6.9 | 7.0 | 7.0 | 7.3 | 7.5 | 7.4 | ||
| 3 |
|
HCV | 5.2 | 5.5 | 6.2 | 5.6 | 6.3 |
