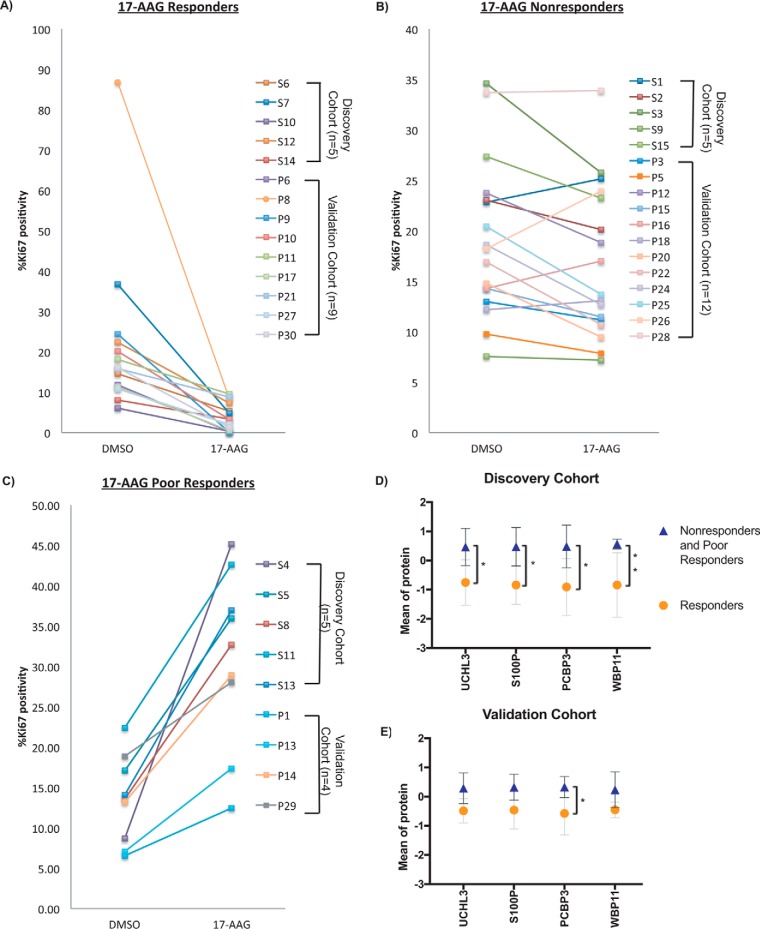
Fig. 7.
Identification of predictive biomarkers of 17-AAG response. A, Ki67 levels for PDE samples that responded to 17-AAG treatment (decrease in Ki67 by -log2(0.5)). B, Ki67 levels for PDE samples unresponsive to 17-AAG treatment (no significant change in Ki67 positivity). C, Ki67 levels for PDE samples with a poor response to 17-AAG treatment (increase in Ki67 by +log2(0.5)). D, Mean expression and 95% CI of 4 proteins with significantly increased expression in discovery cohort “Nonresponder” and “Poor Responder” PDEs (n = 10) compared with “Responders” (n = 5). t test corrected for multiple comparisons using Holm-Sidak method (*adjusted p value ≤0.05, **adjusted p value ≤0.01). E, Mean expression and 95% CI of 4 proteins with significantly increased expression in validation cohort “Nonresponder” and “Poor Responder” PDEs (n = 16) compared with “Responders” (n = 9). t test corrected for multiple comparisons using Holm-Sidak method (*adjusted p value ≤0.05).

