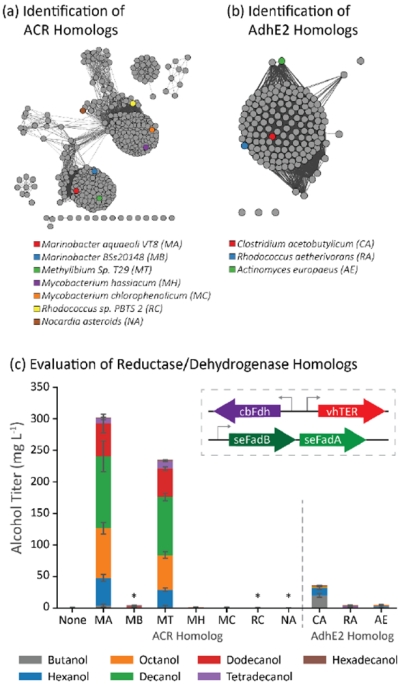
Figure 4.

Identification and evaluation of ACR homologs as components in a β-reduction pathway. (a) The sequence similarity map of ACR homologs shows multiple groupings of sequence homologs. The quantitative relationship between the sequences is shown in Supplementary Figure 3a. (b) AdhE2 homologs identified were found in only a single grouping. The quantitative similarity between the AdhE2 homologs is shown in Supplementary Figure 3b (c) Most ACR homologs failed to generate alcohols in E. coli cells coexpressing vhTER, cbFdh, and seFadBA. Many of the nonproducing ACR variants failed to express soluble protein (labeled with *; see Supplementary Figure 4 for Western). Error bars represent the standard deviation of triplicates performed on separate days.
