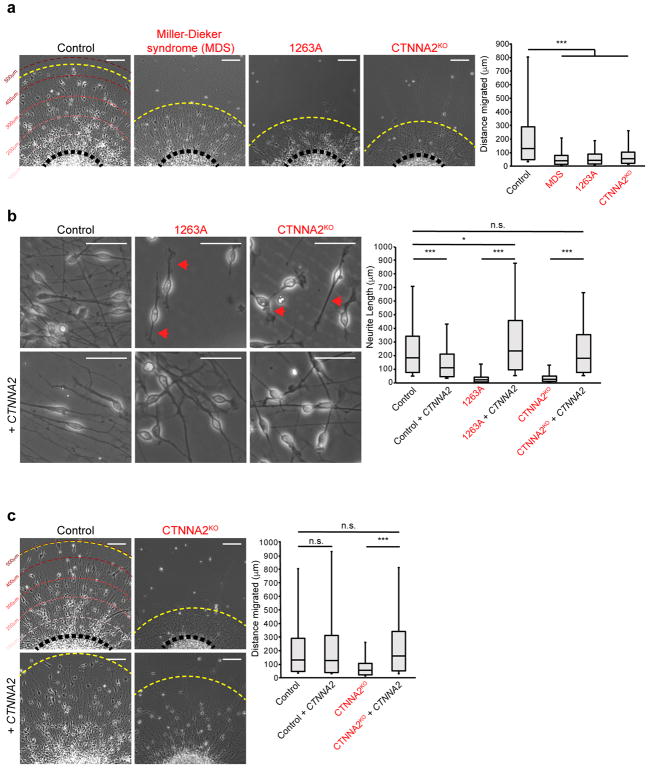
Figure 2. Loss of CTNNA2 mirrors Miller-Dieker syndrome (MDS) migration phenotypes in iPSC-derived neurons.
(a) Quantification of neuronal migration from human iPSC-derived neurospheres. MDS-derived neurons do not migrate as far as Control neurons. Migrating neurons from affected member of Family-1263 (1263A) showed reduced migration, similar to CTNNA2KO neurons. The distribution of migrating neurons at right, box plot with top box: Q3, bottom box: Q1, and Median. The whiskers represent the minimum and maximum values observed in the dataset. Repeated in three independent iPSC clones per patient or three CTNNA2KO clones, 828 cells scored. *, significance (see Statistics and Reproducibility) Scale bar 100 μm.
(b) Control neurons show bipolar morphology with long extended primary neurites. CTNNA2 patient and knockout neurons show thickened, short neurites (red arrows), rescued by forced expression of CTNNA2. The distribution of neurite length at right, box plot with top box: Q3, bottom box: Q1, and Median displayed. The whiskers represent the minimum and maximum values observed in the dataset. Repeated in three independent iPSC clones per patient or three CTNNA2KO clones, 552 cells scored. *, significance (see Statistics and Reproducibility). Scale bar 50 μm.
(c) Rescue of neuronal cell body migration distance upon forced expression of CTNNA2 in CTNNA2KO lines. The distribution of migrating neurons at right, box plot with top box: Q3, bottom box: Q1, and Median displayed. The whiskers represent the minimum and maximum values observed in the dataset. Repeated in three CTNNA2KO clones, 532 cells scored. * and ***, significant P (see Statistics and Reproducibility). Scale bar 100 μm.

