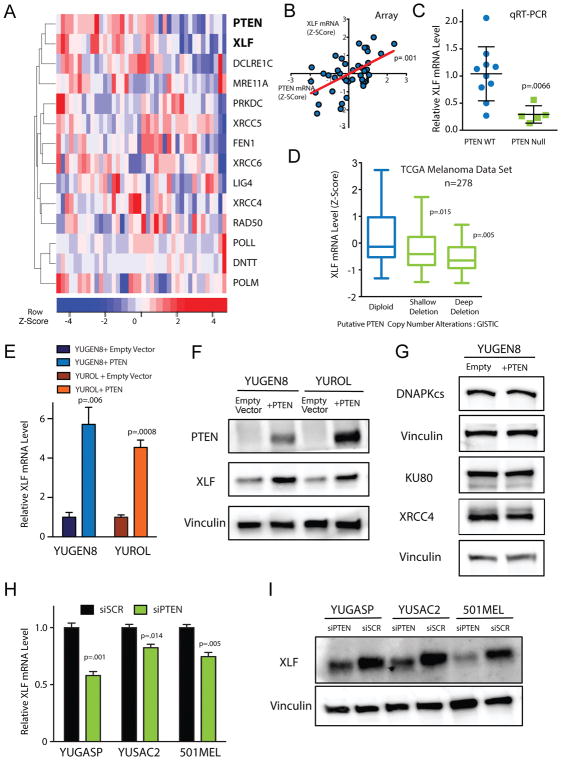
Figure 2. PTEN status is correlated with XLF expression.
(A) Unsupervised clustering of PTEN expression with expression of NHEJ genes in the Yale Melanoma Gene Expression Cohort. (B) Scatter plot of PTEN expression vs. XLF expression in the melanoma cohort (n=40). Two-tailed p-value was determined from correlation regression analysis. (C) Relative XLF mRNA levels across melanoma samples assayed by qRT-PCR. Error bars represent SEM of samples analyzed in triplicate. (D) Analysis of XLF mRNA levels as a function of PTEN copy number alteration in TCGA cutaneous melanoma RNA and DNA sequencing data (n=278). (E) Relative XLF mRNA levels in YUGEN8 and YUROL cells complemented with PTEN or empty vector control. mRNA levels were normalized to GAPDH mRNA and presented relative to empty vector control. Error bars represent SEM (n=3). (F) Western blot for XLF protein expression in YUGEN8 and YUROL cells complemented with PTEN or empty vector controls. Vinculin is used as a loading control. (G) Western blot analysis of DNA-PKcs, Ku80 and XRCC4 protein levels in YUGEN8 cells with or without PTEN complementation. Vinculin is used as a loading control. (H) Relative XLF mRNA levels in YUGASP, YUSAC2 and 501MEL cells, comparing PTEN siRNA knockdown to scrambled siRNA control. mRNA levels were normalized to GAPDH mRNA and presented relative to siSCR. Error bars indicate SEM (n=3). (I) Western blot of XLF expression comparing siPTEN with siSCR in YUGASP, YUSAC2 and 501MEL cells. Vinculin is used as a loading control. For (C), (D), (E) and (H) statistical analysis was by t-test.

