
Figure 2. 53BP1- and Shieldin-dependent localization of CST to dysfunctional telomeres.
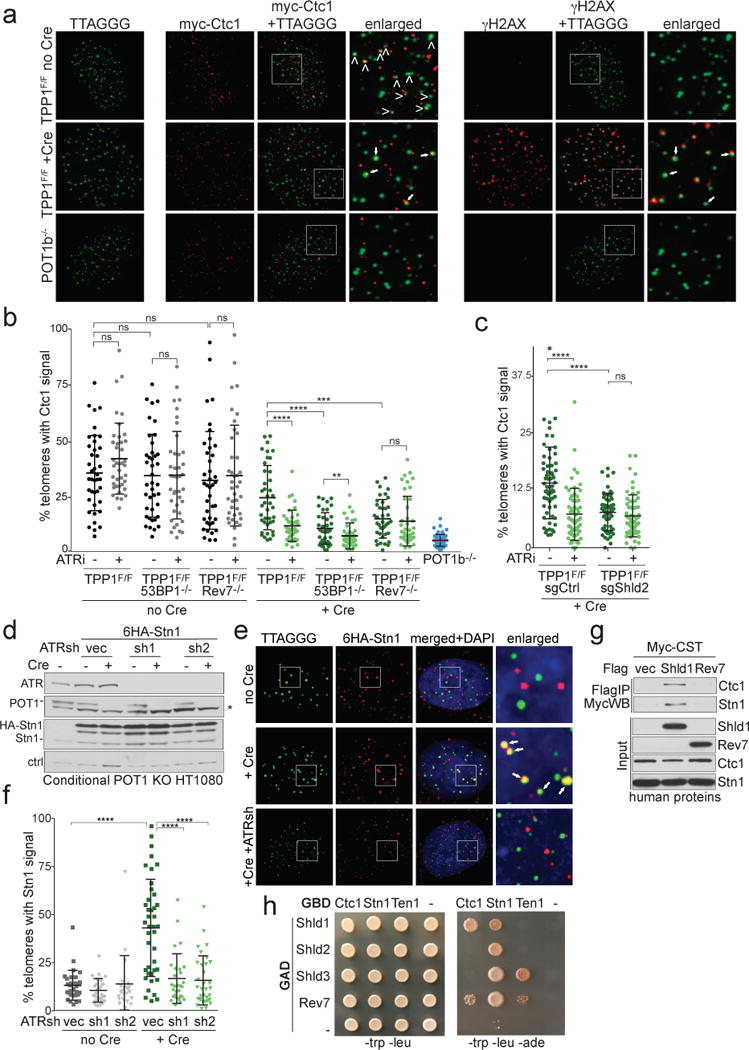
a, Left: Representative IF-FISH for 6myc-tagged Ctc1 (red) at telomeres (false-colored in green) in TPP1F/F MEFs before and after Cre (96 h). Arrowheads: Ctc1 at telomeres. POT1b−/− cells control for spurious telomere-Ctc1 co-localization. Right: The same nuclei showing γ-H2AX (red) at telomeres lacking TPP1. The γ-H2AX and Ctc1 signals are both false-colored in red. Arrows: telomeres with Ctc1 and γ-H2AX. b, Quantification of the % of telomeres co-localizing with Ctc1 detected as in (a). Each dot represents one nucleus from the indicated TPP1F/F cell lines with and without Cre and/or ATRi. Means and SDs from three independent experiments. c, As in (b) but using TPP1F/F cells treated with a Shld2 or a control sgRNA. Means and SDs as in (b). d, Immunoblots for POT1 deletion, ATR knockdown, and HA-Stn1 in conditional POT1 KO HT1080 cells. Asterisk: non-specific band. e, IF-FISH showing telomeric DNA co-localizing with Stn1 in cells as in (d) treated with Cre (96 h) and ATR shRNAs. f, Quantification of Stn1 localization at telomeres before and after POT1 deletion with or without ATR shRNAs as in (e). Means and SDs from three independent experiments. Each symbol represents one nucleus. g, Immunoprecipitation of human CST (each subunit Myc-tagged) with Flag-tagged human Shld1 or Rev7 co-expressed in 293T cells. h, Yeast 2-hybrid assay for interaction between CST and Shieldin subunits. All data panels in the figure are representative of three experiments. All means are indicated with center bars and SDs with error bars. All statistical analysis as in Fig. 1.