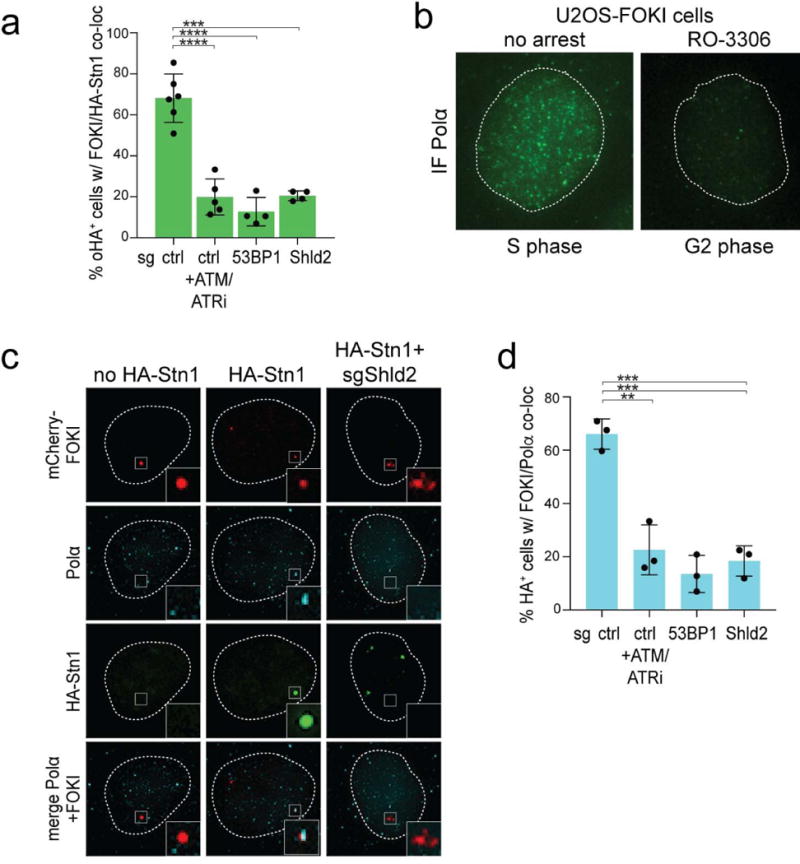
Extended Data Figure 6. Localization of CST and Polα to DSBs.

a, Quantification of HA-Stn1 localization to FOKI-induced DSBs as in Fig. 3e. Means (center bars) and SDs (error bars) from 4-6 independent experiments (>80 induced nuclei for each condition in each experiment) are shown. b, IF for endogenous Polα in FOKI-LacI U2OS cells in S phase and after RO3306 treatment (G2). Dotted line: outline of the nucleus. Representative of two experiments. c, Examples of HA-Stn1 and Polα localization at FOKI-induced DSBs in G2-arrested FOKI-LacI U2OS cells (as in Fig. 3f). Representative of three experiments. d, Quantification of co-localization of Polα with FOKI-induced DSBs (as in Fig. 3f). Means (center bars) and SDs (error bars) from three independent experiments (>80 induced nuclei for each condition in each experiment) are shown. All statistical analysis as in Fig. 1.
