
Figure 3. Loss of EYA3 in LLC tumor cells attenuates tumor growth.
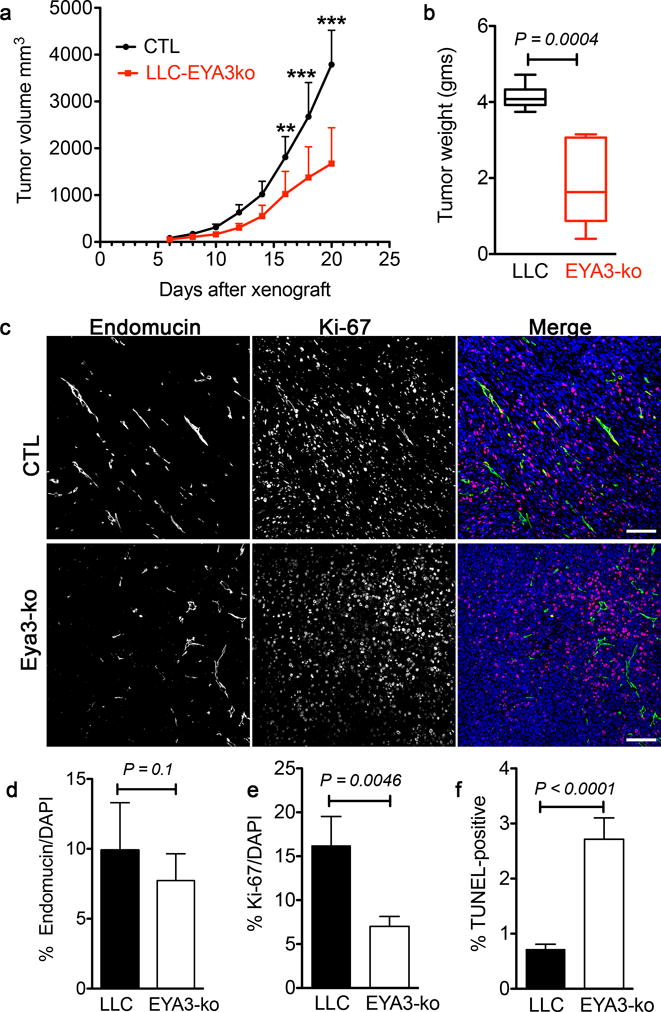
a) Tumor volume over time from xenografts performed with LLC and LLC-EYA3-ko cells in C57/Bl6 mice. Data represent mean and SD. Two-way ANOVA with Bonferroni’s post-test was used. n = 8 animals in each group, ** P<0.01, *** P<0.001.
b) Final tumor weights from xenografts performed with LLC and LLC-EYA3-ko cells in C57/Bl6 mice. Data represented as a box and whiskers plot where the box extends from the 25th to 75th percentile and the whiskers are drawn between the smallest and largest values. The median is indicated by a horizontal line in the box. A paired t-test was used comparing LLC (CTL) and EYA3-ko tumors in the same animal (n = 8 in each group).
c) LLC and EYA3-ko tumors co-stained with the endothelial marker Endomucin and the proliferation marker Ki-67. Sections were counter-stained with DAPI to show nuclei. Scale bar 100 μm.
d) Quantitation of Endomucin-positive area in LLC and EYA3-ko tumors. Four representative images were analyzed from each tumor. Data represents mean and SD (n = 5 tumors from each group).
e) Quantitation of Ki-67 index in LLC and EYA3-ko tumors. Four representative images were analyzed from each tumor. Data represents mean and SD (n = 5 tumors from each group).
f) Quantitation of TUNEL staining in LLC and EYA3-ko tumors. Four representative images were analyzed from each tumor. Data represents mean and SD (n = 4 tumors from animals of each group).