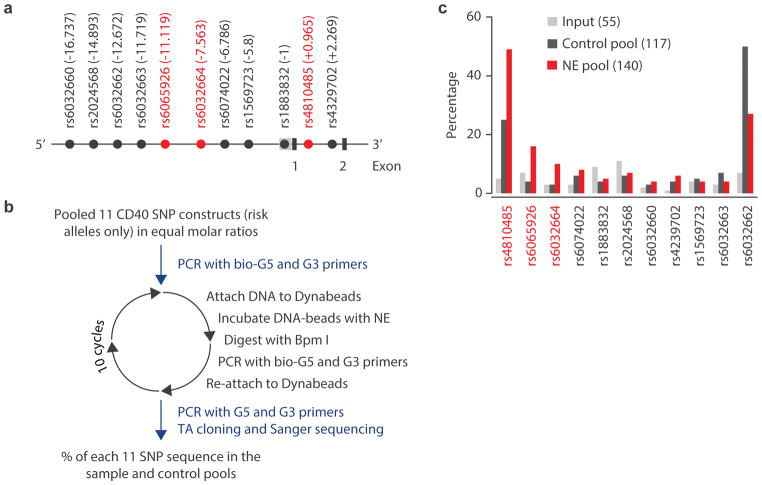
Figure 2. Screening of fSNPs within the CD40 locus.
A. Partial genomic arrangement at CD40 showing the relative positions of the 11 SNPs (in LD R2> 0.8) to the transcription start site +1 and exons 1 and 2. SNPs ultimately implicated by SNP-seq are shown in red. B. The experimental procedure for SNP-seq for the CD40 locus; NE, nuclear extract. C. Screening by SNP-seq at CD40 showing the percentage of each SNP in the input (grey), control (black) and NE (red) pools. The numbers in the parenthesis represent the total numbers that were counted after Sanger sequencing. The uneven amplification reflects PCR bias towards certain sequences such as rs4810485 and rs6032662.

