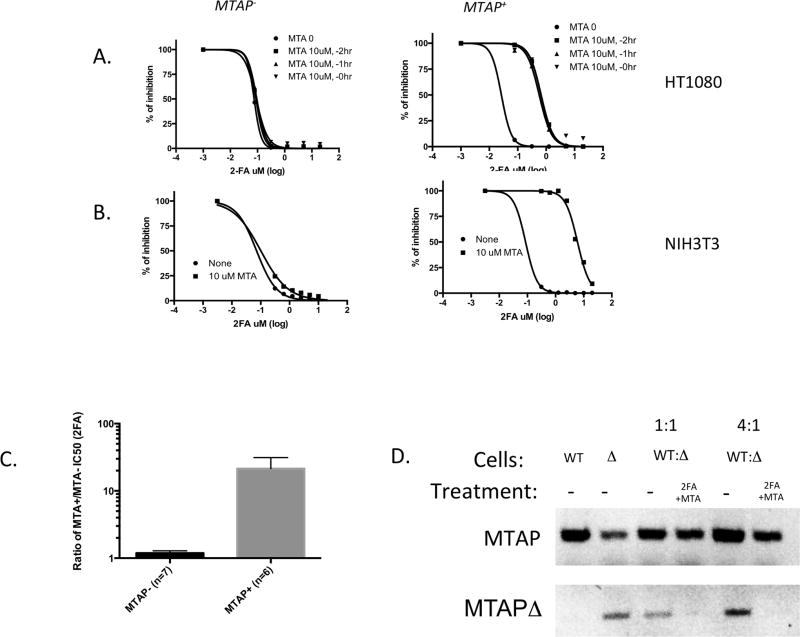
Figure 2.
Effect of MTA on 2FA IC50 in isogenic MTAP+ and MTAP− cell lines. A, Dose response curve for HT1080:MTAP− and HT1080:MTAP+ cell lines treated in the absence or presence on 10 µM MTA. Cells were given MTA either one or two hours before 2FA treatment, or at the same time. B, Dose response curves for NIH3T3 mouse fibroblasts that have had MTAP deleted by CRISPR technology and non-deleted controls. C. Graph shows the ratio of calculated IC50 for 2FA either in the presence or absence of 10 µM MTA for 13 different cell lines (Supplementary Table 2). Asterisk indicates P<0.002. D, Mixing experiment. DNA gel showing bands from Top row shows PCR product using primers specific for either wild-type MTAP, while bottom row shows PCR product specific toward MTAPΔ allele. DNA from untreated wild-type NIH3T3 cells (WT) or CRISPR MTAPΔ cells are shown in first two lanes (note some WT allele is still present in the CRISPR population). These two cell lines were then mixed in either a 1:1 or 4:1 ratio and treated with 1.25 µM 2FA/10 µM MTA for 70 hours or left untreated and PCR was performed on isolated DNA.

