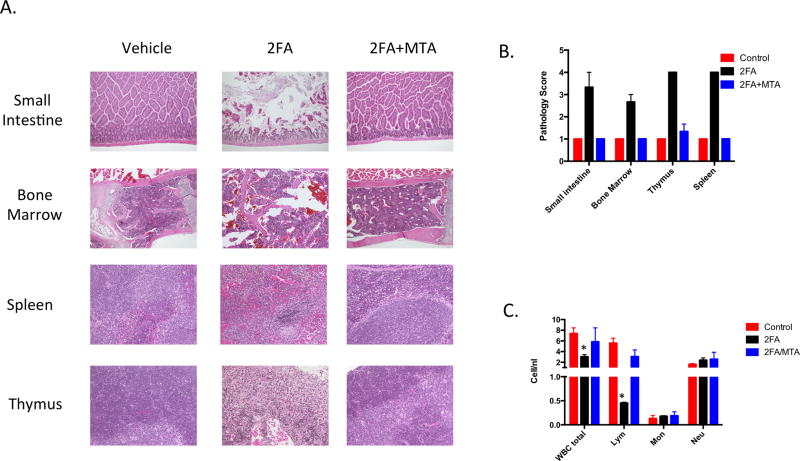
Figure 4.
2FA toxicity in mouse tissues. C57BL6 mice (n=3/group) were injected with either vehicle, 20 mg/kg 2FA, or 20 mg/kg 2FA +100 mg/kg MTA for four consecutive days. Tissue was collected on day 5. A, Representative images of indicated H and E stained tissues. B, H and E stained images were rated blindly by a pathologist on a four point scale (1=normal; 4=severe cellular atrophy). Mean ratings for each tissue is shown. C, Bar chart showing various white blood cell measures in control and treated animals. Error bars show SEM. Asterisk indicates P<0.05 compared to untreated control.

