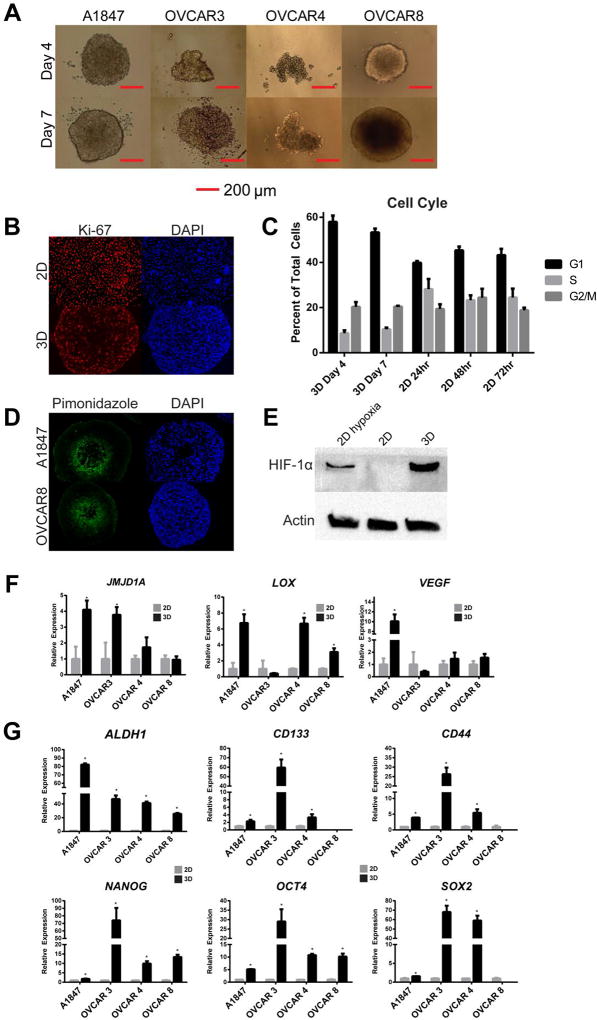
Figure 1. MCTS formation induces senescence, hypoxia and stemness in ovarian cancer cells.
(A) Light microscopy images of MCTS of EOC cell lines. (B) Immunofluorescence staining of Ki-67 in 2D A1847 cells and in a cross-section of MCTS. (C) Cell cycle analysis reveals an increase in G1 cell populations at both day 4 and day 7 in A1847-derived MCTS, compared to 2D cells. (D) Piminidozole staining in A1847 and OVCAR8 cells indicates areas of cellular hypoxia in spheroid cores at day 4. Cell nuclei were labeled with DAPI. (E) HIF-1α protein is stabilized in A1847 2D cultures under hypoxia (0.5 % oxygen) and in A1847 MCTS under atmospheric (normoxic) oxygen but not in A1847 2D cultures. (F) Expression of hypoxia related transcripts were increased in ovarian MCTS compared to parental 2D cultures under normoxia after 7 days (n=3,* = p<0.05, t-test). (G) Several stem-like genes were upregulated in in day 7 MCTS compared to parental 2D cultures (* = p<0.05, t-test). All bar graphs are represented as mean +/− SD, n=3.

