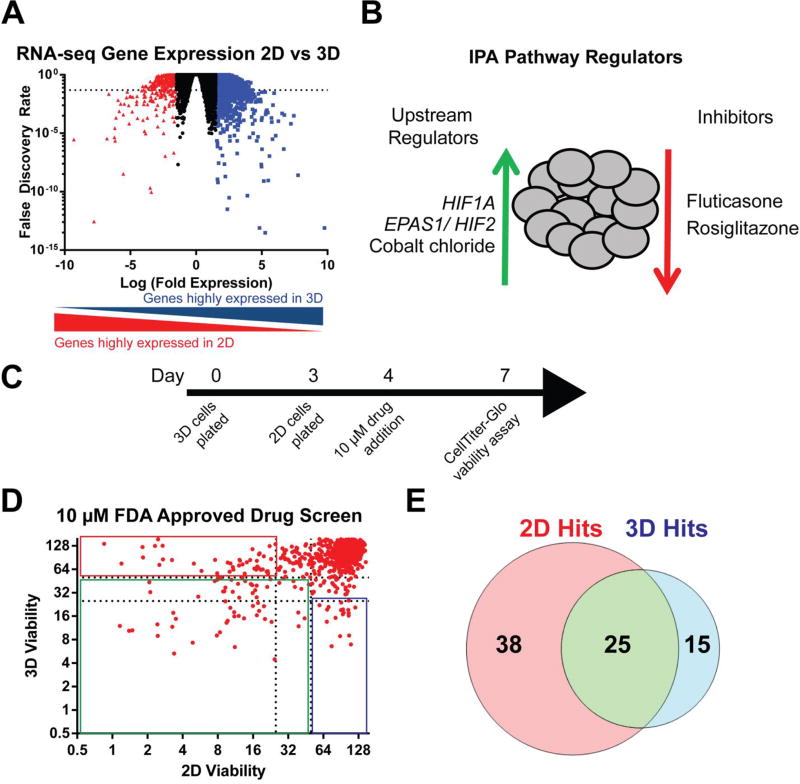
Figure 3. Drug repurposing screen in ovarian cancer MCTS identifies unappreciated drug candidates.
(A) Analysis of RNA-seq data identified genes expressed 1.5-fold or greater in 3D cultures (blue) versus 2D and genes 1.5-fold or greater in 2D cultures (red) versus 3D with a FDR less than 0.05 (dashed line). (B) IPA shows the top five regulators inferred from the genes identified to be over expressed in 3D cultures. (C) Representative time-line for drug screening in 2D and 3D cultures. (D) Relative viability compared to vehicle (DMSO) compared in both 2D and 3D cultures following 72 h treatment using 10 µM drug. (E) Venn diagram representing unique and common drug hits: 2D hits with >75% reduction viability in 2D cultures and < 50% reduction in viability in 3D cultures; 2D and 3D hits with > 75% reduction in viability for both 2D and 3D cultures; and 3D hits with > 75% reduction in viability in 3D cultures and < 50% reduction in viability in 2D cultures.

