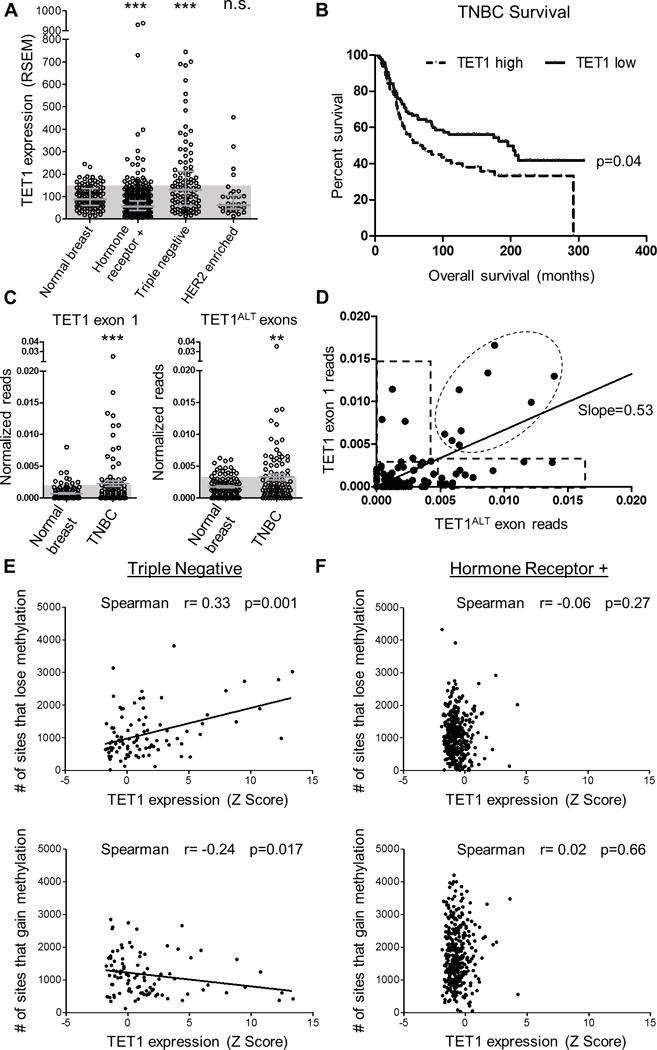
Figure 1. TET1 overexpression is associated with hypomethylation.

(A) TET1 expression (RNA-seq, RSEM values) for normal breast, HRBC, TNBC and HER2 enriched. Shaded blue boxes represent 1 standard deviation above the mean of normal. Error bars are median with interquartile range. T-test was used to measure significance. (B) Survival curve based on TET1 expression in TNBC. TET1 high is classified as patients with stdev>1 above the mean. (C) In vivo analysis of TCGA RNA-seq reads from normal breast and TNBCs. Normalized exon reads for TET1FL exon 1 (left) and TET1ALT exons (right). Y axis is reads from TET1ALT exon 1a + exon 1b or TET1 exon 1/exon length/chromosome 10 reads × 1e6. Mann-Whitney test was used for significance. D) TET1 exon 1 reads vs TET1ALT exon reads for TNBC patients. Expression was considered high if it was >2 standard deviations above the mean of normal for each isoform. (E) TNBC analysis and (F) HRBC analysis of # of sites that lose methylation (top) and # of sites that gain methylation (bottom) compared to normal breast vs TET1 expression Z score.
