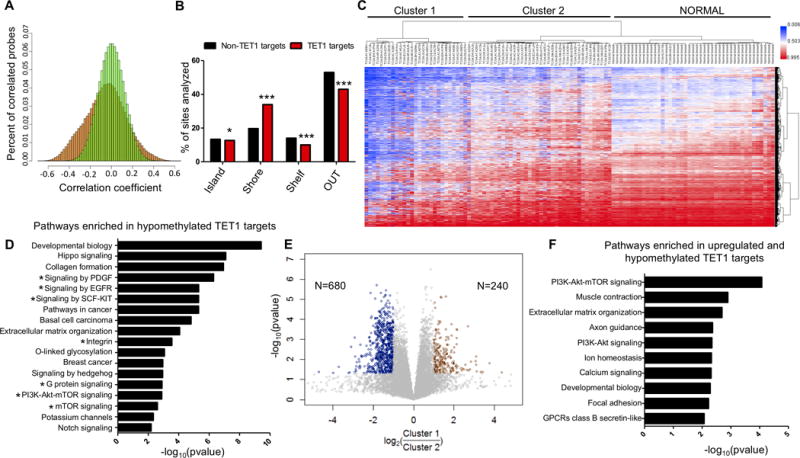
Figure 2. Identification of putative TET1 targets in TNBC.

(A) Frequency distribution of Spearman correlation r values (TET1 expression vs DNA methylation) in TNBC patients. X axis (correlation coefficient) and Y axis (percent of correlated probes). 1000 permutations of the data (green) and real dataset (orange). (B) Location of putative TET1 targets and non TET1 targets relative to CpG islands. (C) Unsupervised cluster analysis of methylation in TNBC for the putative TET1 targets (N=17,521 sites), including 41 normal breast controls. (D) Pathway analysis of putative TET1 targets. X axis is −log10(pvalue). (E) Differential gene expression analysis between Cluster 1 and Cluster 2. Y axis is −log10(pvalue) and x axis is log2(Cluster 1/Cluster 2). Genes were considered upregulated if FC>2 or FC<0.5 and p<0.05 (t-test). (F) Pathway analysis of genes that are hypomethylated and upregulated in Cluster 1.
