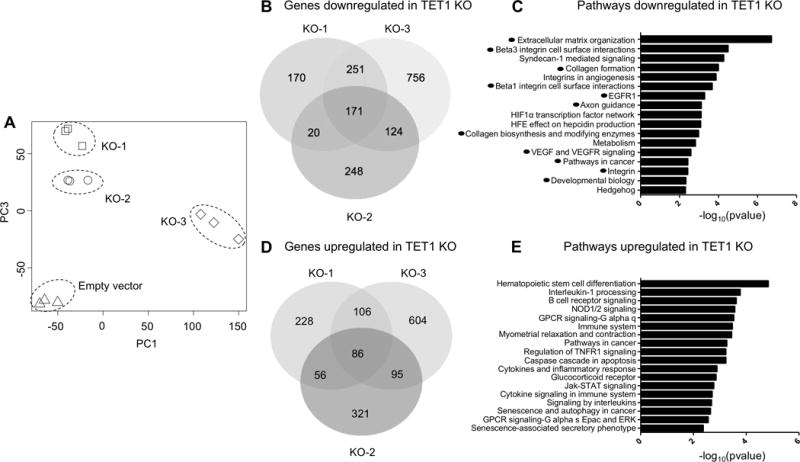
Figure 4. Gene expression targets of TET1 in vitro.

(A) Principal component analysis of RNA-seq data for empty vector, TET1 KO-1, KO-2 and KO-3 (in triplicate) in MDA-MB-231 cells. (B) Venn diagram overlap of genes downregulated in the TET1 KO cells. (C) Pathway analysis of genes downregulated in TET1 KO clones. X axis −log10(pvalue). (D) Venn diagram overlap of genes upregulated in the TET1 KO cells. (E) Pathway analysis of genes upregulated in TET1 KO clones.
