
Extended Data Figure 6. WGD and mutational burden.
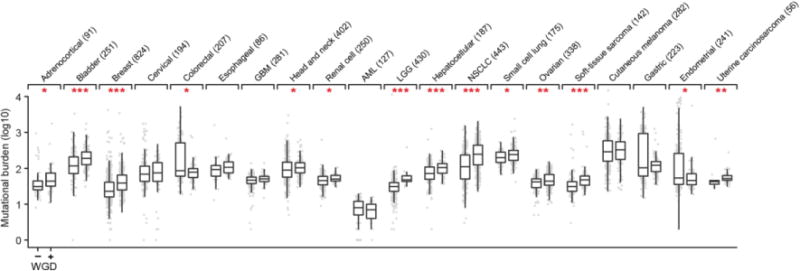
Somatic mutational burden (point mutations and small insertions and deletions) in tumors with and without WGD in each of 20 cancer types with 20 or more WGD-positive specimens (sample sizes indicated in parentheses). All box plots represent the minimum, first quartile, median, third quartile, and maximum values (outliers detected using the standard 1.5*IQR method) within a given cancer type. Asterisks reflect statistically significant differences within cancer types (nominal p-value < 0.05, two-sided Wilcoxon test; one, two and three asterisks correspond to p-values between 0.01 and 0.05, 0.001 and 0.01, and less than 0.001 respectively). Data utilized here is from whole-exome sequencing from specimens in The Cancer Genome Atlas (TCGA) that are of cancer types overlapping with those included in our prospective cohort. TCGA data was utilized for its increased power to determine mutational burden.