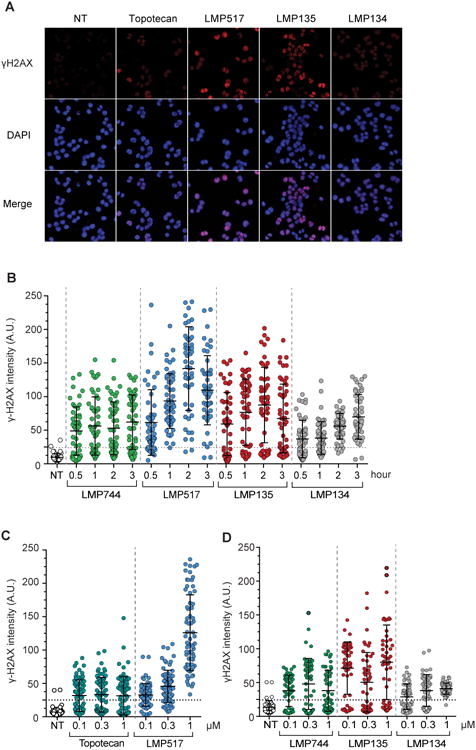
Figure 3. Cellular DNA damage induced by the fluoroindenoisoquinolines.

A, Representative immunofluorescence confocal microscopy images. HCT116 cells were treated with the indicated drugs (1 μM for 1 h at 37°C). Following fixation, cells were stained for histone γH2AX and DAPI. B, Quantitative analysis of γH2AX as a function of time. Cells were treated with 1 μM of topotecan, LMP744, LMP517, LMP134 and LMP135 for the indicated times (h). γH2AX signal intensities of 50 cells (each individual cell represented as a dot) were measured by image-J. Same sized area signal was quantified in each nucleus and plotted for each condition. C and D, Quantitative analysis of γH2AX induction as a function of drug concentration. Cells were treated as indicated for 1 h. γH2AX signal intensities of 70 cells were measured by image-J as in panel B. Signals below the horizontal dotted lines are within background signal for untreated cells.
