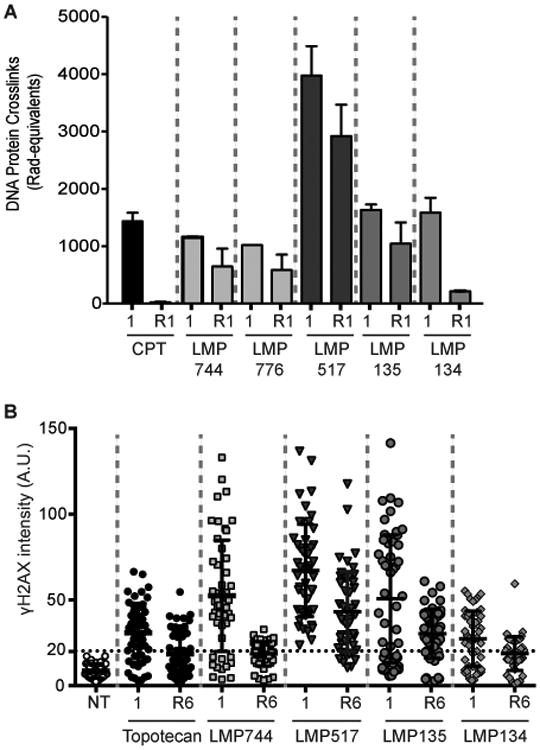
Figure 4. Persistent DNA damage and TOP1cc in cells treated with the fluoroindenoisoquinolines.

A, Quantitative analysis of TOP1cc after drug removal in CCRF-CEM cells. Cells were treated with 1 μM CPT, LMP744, LMP776, LMP517, LMP134 or LMP135 for 1 h at 37°C. Drugs were removed and cells were grown for another hour in drug-free medium (R1). TOP1cc were determined as DPC by alkaline elution. Percent reversal for each drug is indicated in the text. B, Quantitative analysis of γH2AX persistence 6 h after drug removal. HCT116 were treated for 1 h with 1 μM drug concentration, and either fixed at that point (1 h) or grown for an additional 6 h in drug-free medium (R). γH2AX signal intensities of 50 cells (each individual cell represented as a dot/circle) were measured by image-J. Same sized area signal was quantified in each nucleus. Percent reversal for each drug is indicated in the text. Points below the horizontal dotted lines are γH2AX signals within background signal for untreated cells.
