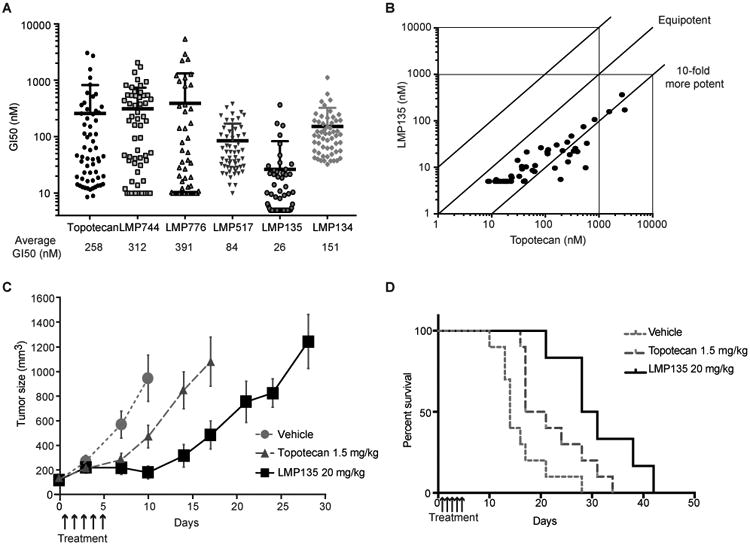
Figure 5. LMP135 is the most potent fluoroindenoisoquinoline in the NCI-60 and shows antitumor activity in small cell lung cancer H82 xenografts model.

A, Comparison of the NCI-60 responses to the indicated TOP1 inhibitors. Each dot represents the growth inhibitory 50% concentration (GI50) of a given NCI-60 cell line for the indicated drug. Data were obtained from the NCI Developmental Therapeutics Program (DTP). Average GI50 for all 60 cell lines is indicated below the graph. LMP744 and LMP776 were not tested under 10 nM and LMP135 under 5 nM, and in those cell lines in which the GI50 was less than the minimum concentration tested, the GI50 values were recorded as 10 and 5 nM, respectively. The “averages” in these cases therefore represent mean-graph midpoint (MGM) values rather than true GI50 averages. B, Comparison of the sensitivity of the NCI-60 cells to LMP135 vs. topotecan. GI50 of each drug for each cell line is indicated as well as equipotency curve. LMP135 is approximately 10-fold more potent than topotecan. C-D, Antitumor activity of LMP135 (20 mg/kg) compared to topotecan (1.5 mg/kg) represented as tumor volume (C) or as Kaplan Meyer curves (D). Bars represent standard deviations (n = 10 for vehicle and topotecan; n = 6 for LMP135).
