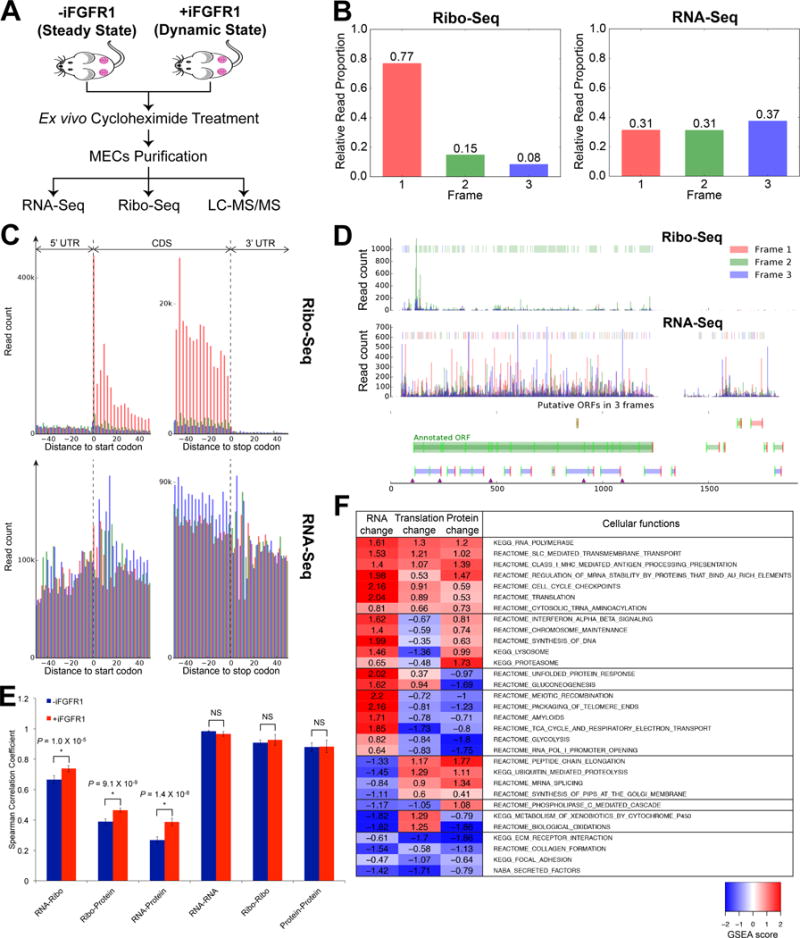
Figure 1.

Ex vivo Ribo-Seq on MECs and multi-omics correlation analysis. A, Schematic overview of tissue processing for multi-omics profiling on MECs from the WNT/iR1 mouse model. B, Distribution of Ribo-Seq RPF reads (left) and RNA-Seq reads (right) across 3 possible reading frames relative to their 5′ ends in all annotated codons; showing proportion of reads from each reading frame. C, RPF and RNA-Seq reads aligned to a composite Refseq transcript, including the CDS, and 5′ and 3′ UTRs. Reads are colored as in (B) corresponding to respective reading frames. D, RPF and RNA-Seq read count profiles of β-actin. Color-coded boxes in the upper area of each plot highlight the dominant reading frame. Note that majority of RPF reads within the annotated ORF are in Frame 2, which is the same frame as the annotated ORF, whereas RNA-Seq reads are not predominantly distributed in any particular frames. E, Comparison of Spearman correlation coefficients for inter-omic and intra-omic (i.e. between biological replicates) correlations in MECs without and with 6-hrs iFGFR1 activation. Note that intra-omic correlations were not significantly different between cells at the steady and dynamic states. *P < 0.05; NS, not significant (P > 0.05); error bars indicate standard deviation. F, Cellular functions differentially or similarly controlled by distinct regulatory processes. For each regulatory step (columns) and cellular function (rows) shown is the magnitude of the normalized gene set enrichment analysis (GSEA) score of the cellular function’s signature in the differential fold changes of RNA, TE and protein levels upon acute iFGFR1 activation. Shown are the most enriched cellular functions; redundant functions were excluded.
