Figure 3.

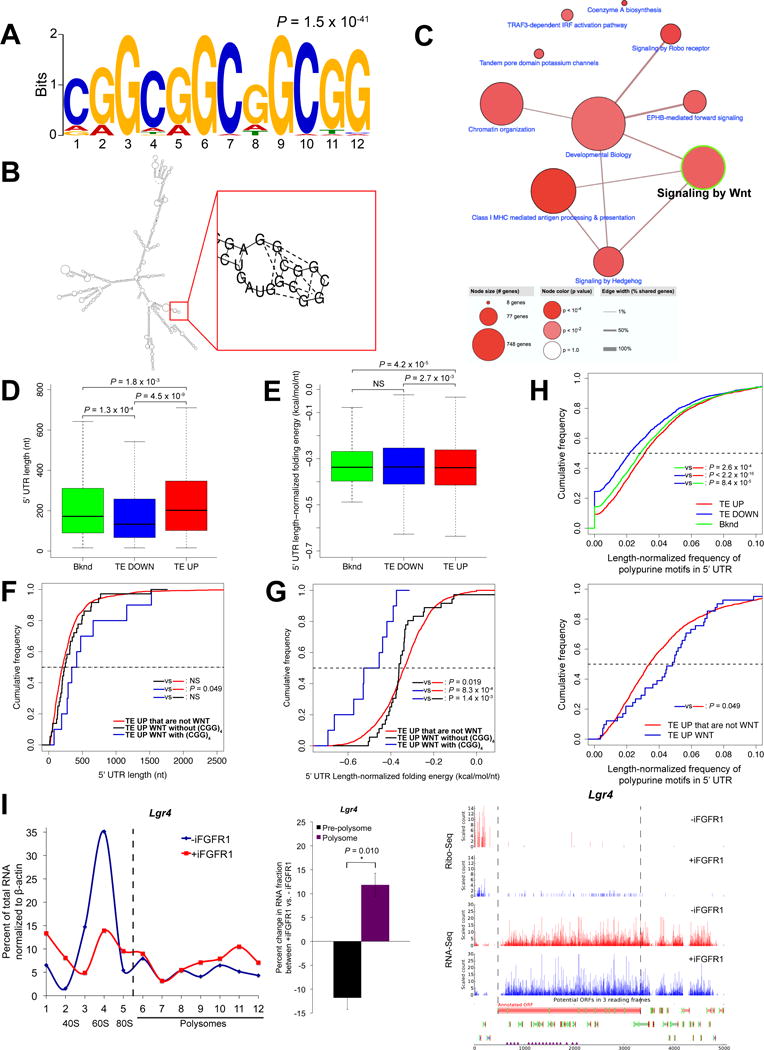
WNT pathway components translationally upregulated by iFGFR1 signaling have structured 5′ UTRs with a high frequency of polypurine sequences and harbor (CGG)4 motifs that can potentially form G-quadruplexes or stable secondary structures. A, The 12-nt (CGG)4 motif enriched in the 5′ UTRs of TE UP genes but not TE DOWN or background genes. B, The 5′ UTR of Ep300 illustrates the (CGG)4 motif and G-quadruplex structure formation using RNAstructure v.6.0 algorithm. C, Pathway annotation networks enriched in TE UP genes that can potentially form G-quadruplexes or stable hairpin structures through the (CGG)4 motif at the 5′ UTR. Note that the “Signaling by Wnt” node highlighted with green border is a major node. D and E, Comparison of 5′ UTR lengths and length-normalized minimum folding free energy, respectively, between TE UP, TE DOWN and background genes. The horizontal bar within each box indicates mean value. All P values shown are less than 0.05; NS, not significant (P > 0.05). F and G, Cumulative distribution of 5′ UTR lengths and length-normalized minimum folding free energy, respectively, in TE UP genes that are WNT signaling components either with (blue) or without (black) the (CGG)4 motif versus other TE UP genes that are not WNT signaling components (red). All P values (Kolmogorov-Smirnov test) shown are less than 0.05; NS, not significant (P > 0.05). H, Cumulative distribution of frequency of polypurine motifs in 5′ UTRs normalized by length in Upper: TE UP, TE DOWN and background genes; Lower: TE UP genes that are WNT signaling components (blue) versus TE UP genes that are not WNT signaling components (red). All P values (Kolmogorov-Smirnov test) shown are less than 0.05. I, Polysome profile (left) shows the proportion of Lgr4 mRNA in each pre-polysome and polysome fraction generated by sucrose gradient fractionation of purified mouse MECs without and with 6-hrs iFGFR1 activation. Relative mRNA levels were measured by qPCR. Shown is a representative of 3 biological replicates. Bar graph (middle) compares changes in proportion of mRNA between fractions. Fractions 1-5 are pre-polysome, and 6-12 are polysome fractions. *P < 0.05; n = 3 biological replicates; error bars indicate standard deviation. Ribo-Seq and RNA-Seq read count profiles (right) of Lgr4. Dashed lines indicate the boundary of the annotated ORF. Read counts were normalized using DESeq size factors.
