Figure 4.

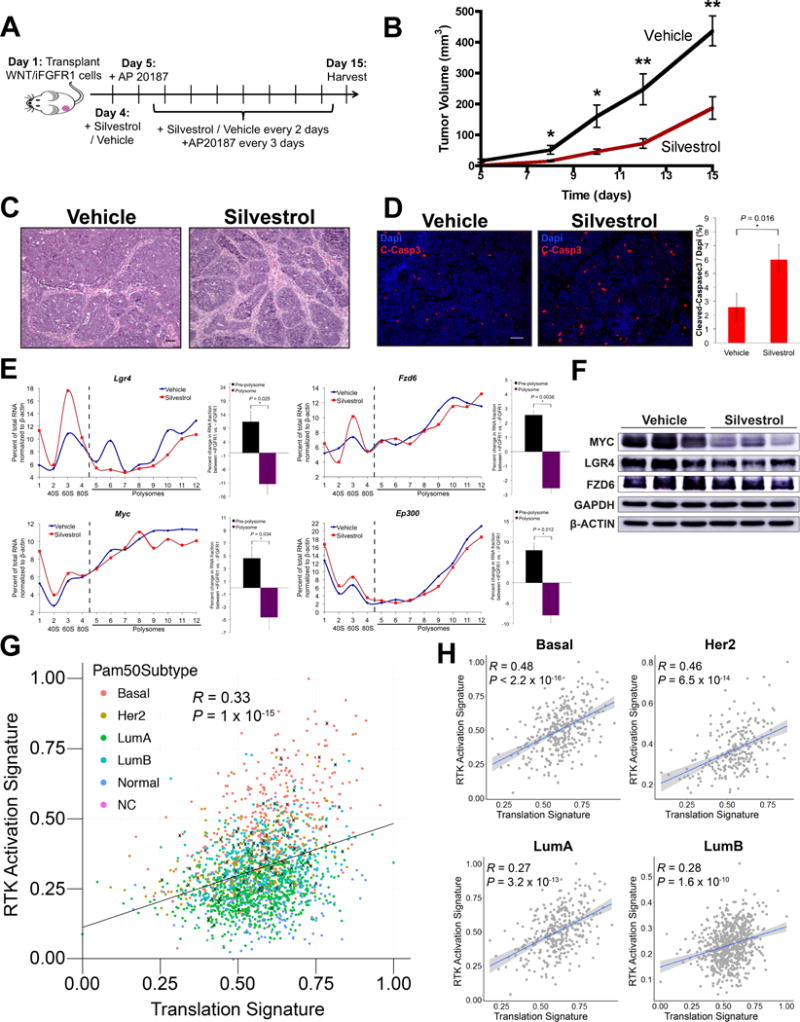
Inhibition of the RNA helicase EIF4A compromises iFGFR1-mediated increase in translation of WNT pathway components and delays iFGFR1-WNT-driven tumorigenesis. A, Treatment scheme with silvestrol against iFGFR1-WNT-driven tumorigenesis. B, Tumor growth curves of mice that were administered vehicle or 1.5 mg/kg silvestrol as described in (A). *P < 0.05; **P < 0.01; error bars indicate standard deviation; n = 9 biological replicates. C, Hematoxylin and eosin staining and D, cleaved-caspase 3 (C-Casp3) immunofluorescence staining of cross-sections from vehicle and silvestrol treated tumors collected at day 15 (scale bar = 50 μm). Bar graph in (D) shows percentage of C-Casp3 positive cells. *P < 0.05; error bars indicate standard deviation; n = 3 biological replicates. E, Polysome profiles show the proportion of mRNAs of WNT signaling components and target genes in each pre-polysome and polysome fraction generated by sucrose gradient fractionation of purified tumor MECs treated with silvestrol or vehicle. Relative mRNA levels were measured by qPCR. Data shown are representative of 3 biological replicates. Bar graph compares changes in proportion of mRNA between fractions. Fractions 1-4 are pre-polysome, and 5-12 are polysome fractions. *P < 0.05; n = 3 biological replicates; error bars indicate standard deviation. F, Western blots of vehicle- and silvestrol-treated tumors in biological triplicates. G, Correlation plot between RTK activation and translation signatures using the METABRIC dataset (n = 1992). Breast cancer subtypes including basal-like (basal), Her2, luminal A (LumA), luminal B (LumB), normal and non-classified (NC) are color-coded. “X” indicates tumors with FGFR1 amplification (copy number > 4). Note that common genes between RTK activation and translation signatures were removed in this analysis, and hence the correlations were not due to overlapping gene identity. H, Correlation plots generated as in (G) for individual breast cancer subtypes.
