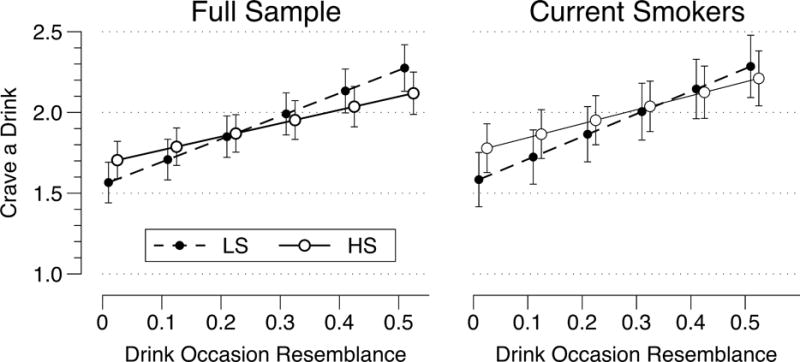
Figure 3.

Model-predicted mean ratings of momentary alcohol craving and associated 95% confidence intervals illustrating alcohol sensitivity × contextual resemblance to drinking situations interactions from idiographic models, using records occurring between 3 p.m. and 3 a.m. Lines are plotted at the mean of the top (LS) and bottom (HS) quartiles of the distribution of standardized person-mean imputed SRE scores (pooled across sexes) to illustrate sensitivity-related effects and at the mean level of all other covariates. LS = Low Sensitivity, HS = High Sensitivity, SRE = Self-Rating of the Effects of Alcohol
