Figure 1.
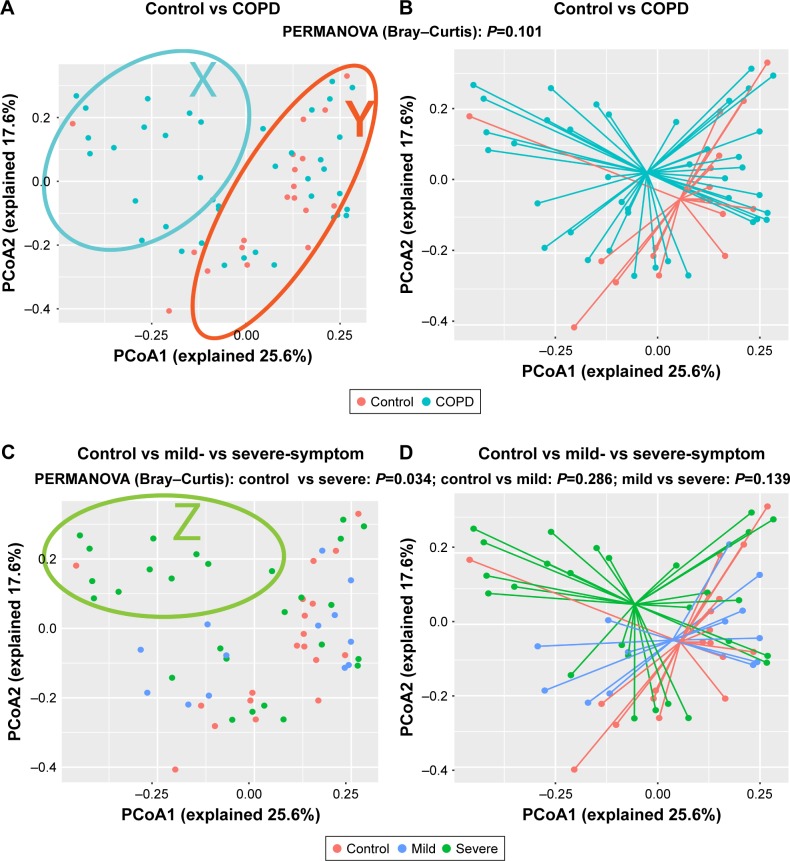
Community composition is shifted in COPD patients with severe symptoms.
Notes: Unsupervised PCoA was plotted based on the Bray–Curtis distance. PERMANOVA was used to determine differences in community composition between groups. (A) Control and COPD are labeled red and blue, respectively. In the X-zone (blue circle), the samples mostly belong to the COPD group; in the Y-zone (red circle), the control group and the COPD group cannot be clearly separated. (B) The control group and the COPD group with centroids added. (C) The COPD patients included two subgroups: “mild symptoms” (SGRQ <25) and “severe symptoms” (SGRQ ≥25). Control, mild symptoms, and severe symptoms are labeled red, blue, and green, respectively. In the Z-zone (green circle), most of the samples belong to the severe symptoms group. (D) The control, mild symptoms, and severe symptoms groups with centroids added.
Abbreviations: PCoA, principal coordinate analysis; PERMANOVA, permutational multivariate analysis of variance; SGRQ, St George’s Respiratory Questionnaire.

