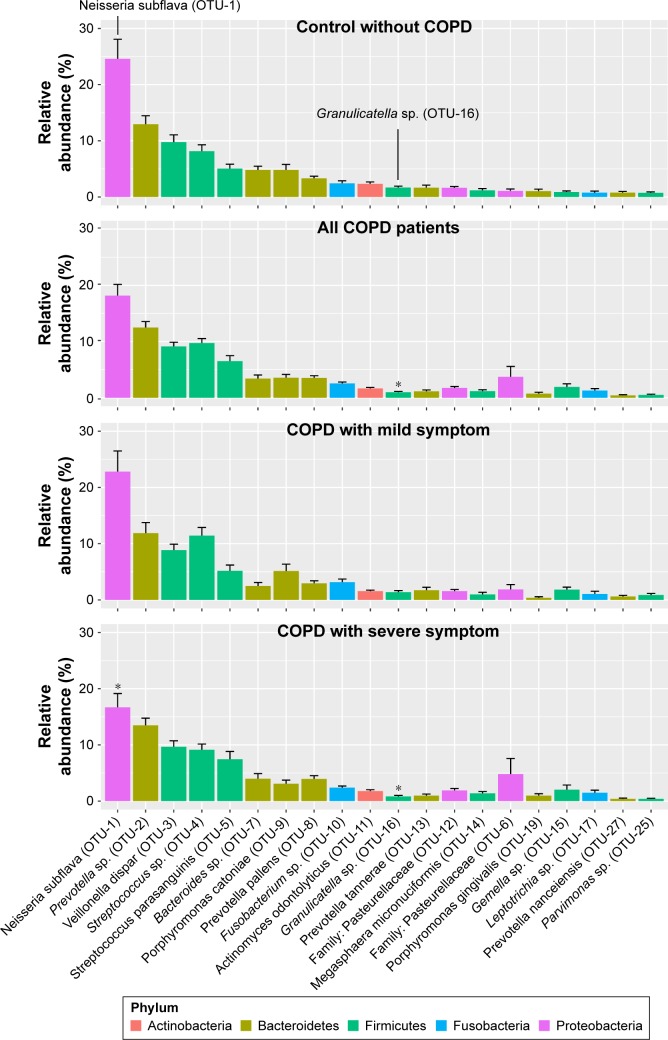
Figure 2.
Relative abundance of OTUs is altered in COPD patients with severe symptoms.
Notes: The top 20 most abundant OTUs identified in the sputum are presented. Asterisks imply that OTUs are significantly altered in this group compared to the controls. Welch’s t-test was used to determine the statistical difference between the controls and COPD patients, and ANOVA with Tukey’s multiple comparisons test was used to detect the statistical discrepancy between the controls and COPD patients with mild (SGRQ<25) and severe symptom (SGRQ≥25). Values are shown as the mean ± SEM.
Abbreviations: ANOVA, analysis of variance; OTU, operational taxonomic unit; SEM, standard error of the mean; SGRQ, St George’s Respiratory Questionnaire.

