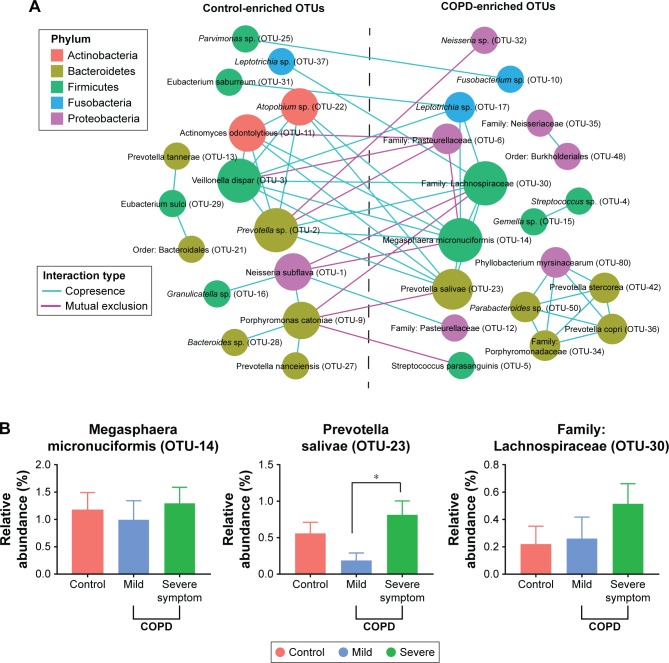
Figure 3.
Interaction of OTUs enriched in controls and COPD patients.
Notes: (A) The color of the nodes represents different phyla, and the size of the nodes is proportional to their degree of connectivity. The bigger node is highly connected with others and may play a more important role in the whole network. The blue and red edges represent co-occurrence (Spearman’s coefficient >0.5 and *P<0.05) and co-exclusion (Spearman’s coefficient <−0.5 and *P<0.05), respectively. (B) Relative abundance of the key OTUs enriched in COPD patients between COPD patients with mild symptoms (SGRQ <25) and COPD patients with severe symptoms (SGRQ ≥25). Statistical significance (*P<0.05) was determined through ANOVA with Tukey’s post hoc test.
Abbreviations: ANOVA, analysis of variance; OTU, operational taxonomic unit; SGRQ, St George’s Respiratory Questionnaire.

