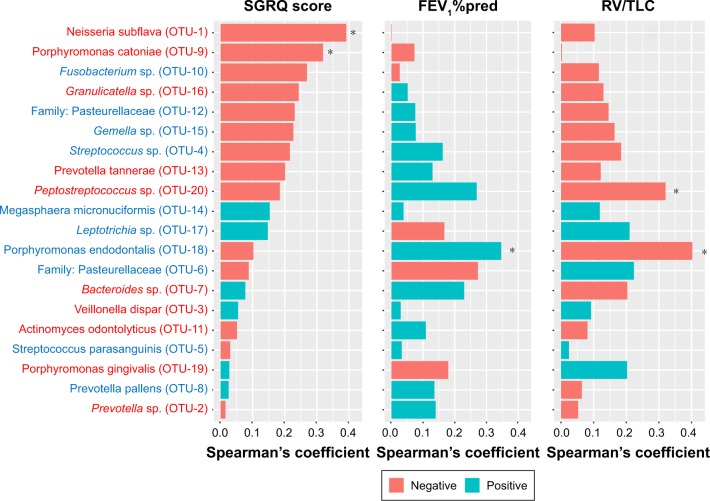
Figure 4.
Relationship between the sputum flora and the clinical phenotypes in COPD patients.
Notes: The associations between OTUs and clinical indexes (SGRQ score, FEV1%pred, RV/TLC, etc.) were determined by Spearman’s coefficient. Red and blue bars denote negative and positive associations, respectively. Asterisks indicate that the association is significant (P<0.05). Y-axis text labeled in red and blue denotes control-enriched OTUs and COPD-enriched OTUs, respectively.
Abbreviations: OTU, operational taxonomic unit; SGRQ, St George’s Respiratory Questionnaire; FEV1%pred, predicted percent of forced expiratory volume in 1 second; RV/TLC, ratio of residual volume to total lung capacity.

