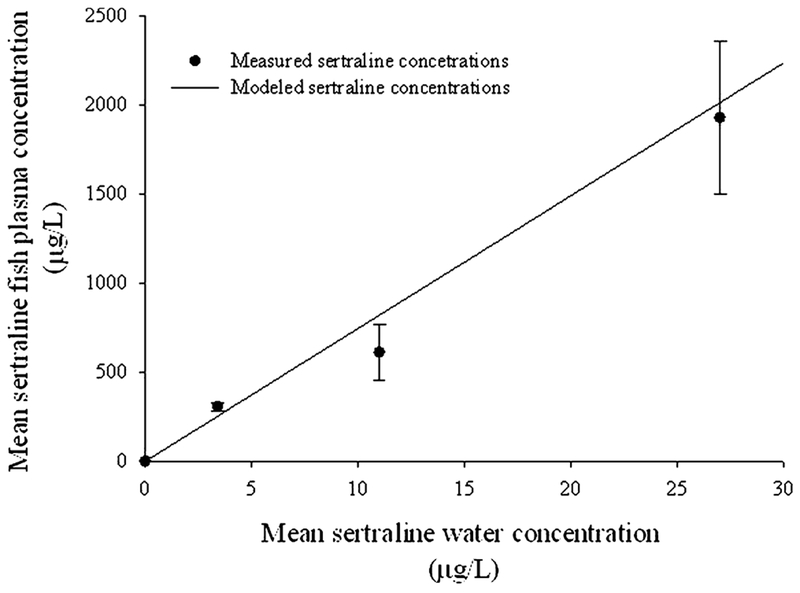
Figure 1.
Relationship between mean (n = 3; ± standard deviation), measured (dots), and modeled (solid line) plasma concentration of sertraline in adult male Pimephales promelas following a 28-d study, based on concentrations quantified in the water column. The modeled plasma concentration is a based on an equation described by Fitzsimmons et al.46 in which log D was substituted for log Kow (Berninger et al.52). y = 70.1(x) − 15.3; r2 = 0.98; p = 0.0001.

