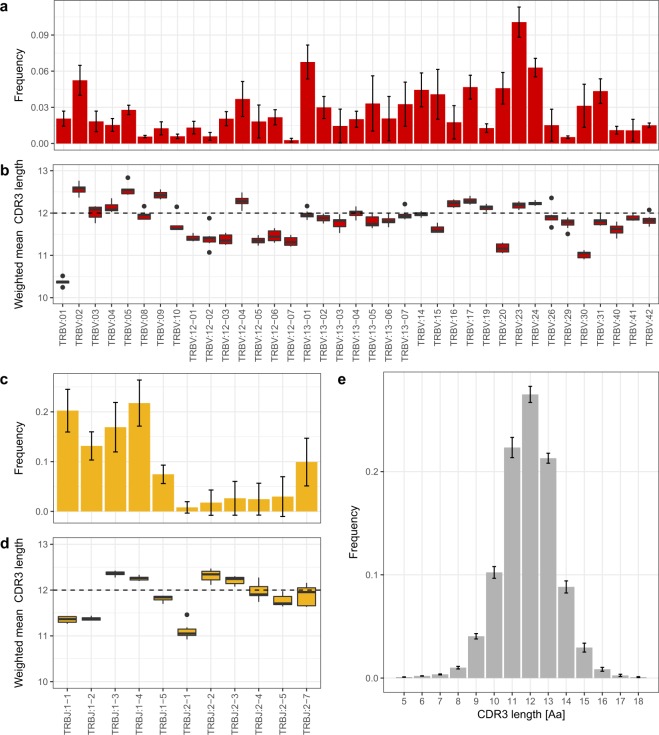
Figure 4.
Mean V–J segment usage and CDR3 length distribution of TCRβ in seven bank voles. (a) Relative usage frequencies of each BV_TRBV gene. (b) Weighted mean (by the number of reads) of the CDR3 amino acid length for each BV_TRBV gene. (c) Relative usage frequencies of each BV_TRBJ gene. (d) Weighted mean (by the number of reads) of CDR3 amino acid length for each BV_TRBJ gene. (e) CDR3 amino acid length distribution. In (a,c,e): the bar height indicates the respective mean frequency from seven individuals, error bars show standard deviations. In (b,d): Tuckey boxplots represent weighted mean CDR3 length formed by each contributing gene segment in seven individuals; whiskers indicate data points within the 1.5 interquartile range; the dashed line marks the global CDR3 length median.

