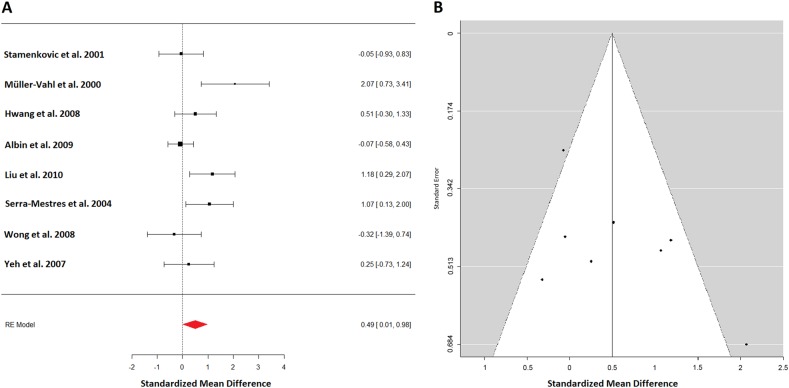
Fig. 1.
a A forest plot of all available dopamine transporter (DAT) studies in TS patients summarizing to an effect size of 0.49 standard deviation, indicating a scarce significant effect of higher dopamine transporter availability in TS patients. b A funnel plot showing the precision of all dopamine transporter studies against their effect estimates. It appears symmetrical except for two outliers one at the right bottom and one at the left top

