Fig. 3.
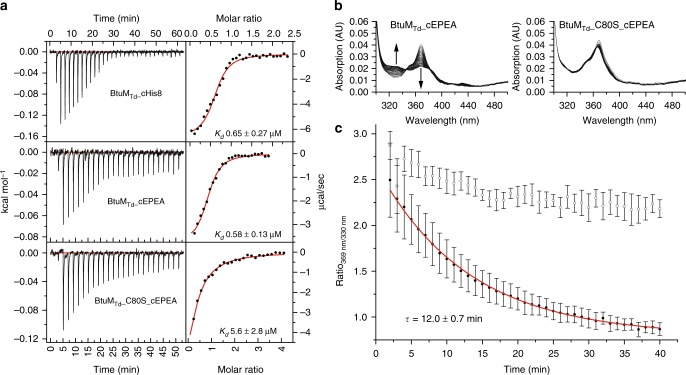
Cobinamide (Cbi) binding to BtuMTd and BtuMTd-catalysed decyanation. a Representative ITC-measurements of differently tagged BtuMTd constructs. BtuMTd with a C-terminal His-tag binds Cbi with a Kd value of 0.65 ± 0.27 μM (top). EPEA-tagged BtuMTd binds Cbi with essentially the same affinity of Kd 0.58 ± 0.13 μM (middle). For the EPEA-tagged mutant version BtuMTd_C80S Kd = 5.6 ± 2.8 μM (bottom). All ITC experiments were performed as technical triplicates, error is s.d. b Decyanation of Cbi catalysed by EPEA-tagged BtuMTd. Upon addition of an excess of BtuMTd to Cbi, the substrate is slowly decyanated, which can be followed spectroscopically (left) with the main spectral changes indicated by the arrows. The mutant BtuMTd_C80S, did not catalyse decyanation (right). c Quantification (error bars are s.d. of technical triplicates) of decyanation reveals that the process is slow. The ratio of the absorption at 369 nm over 330 nm of BtuMTd (black dots) was plotted as function of time. A mono-exponential decay function was fitted to the data (red line) to extract τ = 12 ± 0.7 min (s.d. of technical triplicates), which is comparable to the decyanation rate of the His-tagged protein and the process follows pseudo-first order kinetics (Supplementary Figure 8b, c). The ratio of absorption obtained with the cysteine mutant (open dots), which does not catalyse decyanation, is shown for comparison

