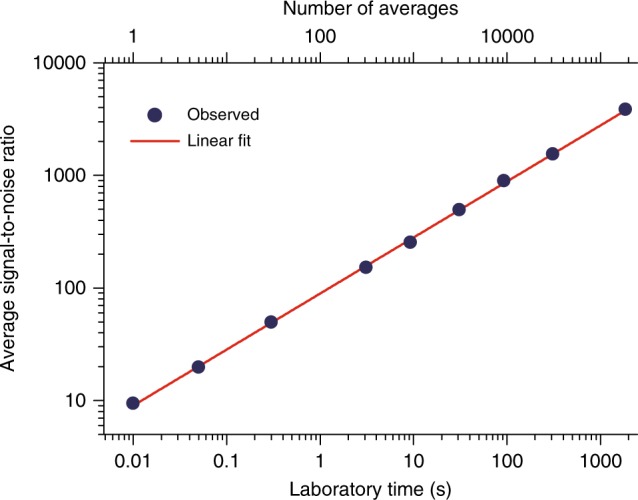
Fig. 4.

Evolution of the signal-to-noise ratio in the spectra with the measurement time. The interferograms are averaged in the time domain and Fourier transformed with a resolution of 100 MHz. The average signal-to-noise ratio in the spectra is plotted for different times of averaging. A linear fit with a slope of 0.503(5) indicates that the signal-to-noise is proportional to the square root of the measurement time, which is expected for coherent averaging. The number in parentheses is the standard deviation in units of the last quoted digit. The trend has not reached its limit at the maximum measurement time of 1860 s
