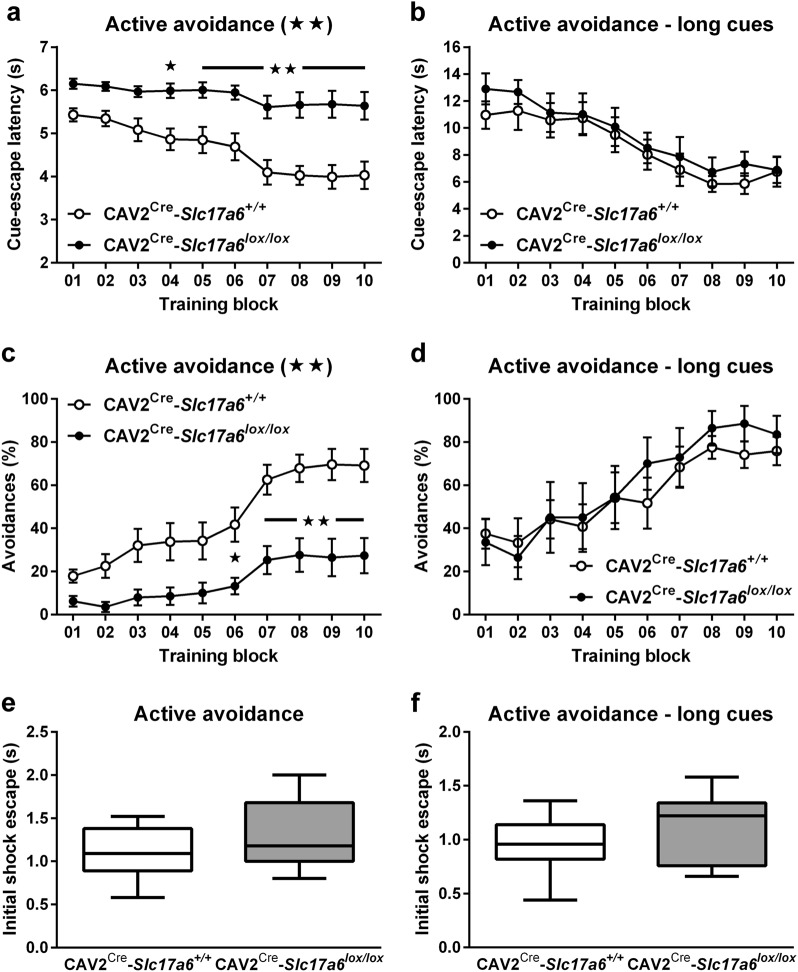
Fig. 6.
Active avoidance behavioral task. a Cue-escape latencies (s) from 5-s (CAV2Cre-Slc17a6+/+ controls n = 12, and CAV2Cre-Slc17a6lox/lox mice n = 17) and from b 14-s auditory cues (CAV2Cre-Slc17a6+/+ controls n = 7, and CAV2Cre-Slc17a6lox/lox mice n = 7). c Percentage of active avoidance responses to 5-s (CAV2Cre-Slc17a6+/+ controls n = 12, and CAV2Cre-Slc17a6lox/lox mice n = 17) and from d 14-s auditory cues (CAV2Cre-Slc17a6+/+ controls n = 7, and CAV2Cre-Slc17a6lox/lox mice n = 7). e Shock-escape latencies (s) for first ten shocks following 5-s (CAV2Cre-Slc17a6+/+ controls n = 12, and CAV2Cre-Slc17a6lox/lox mice n = 17) and f 14-s auditory cues (CAV2Cre-Slc17a6+/+ controls n = 7, and CAV2Cre-Slc17a6lox/lox mice n = 7). Data are shown as mean ± SEM. Statistical significance of genotype effects (repeated-measures two-way ANOVA) are shown in the headings of each panel. Statistical significance of pairwise comparison of means from CAV2Cre-Slc17a6+/+ controls and CAV2Cre-Slc17a6lox/lox mice are shown in a, c, and e. *p < 0.05 and **p < 0.01

