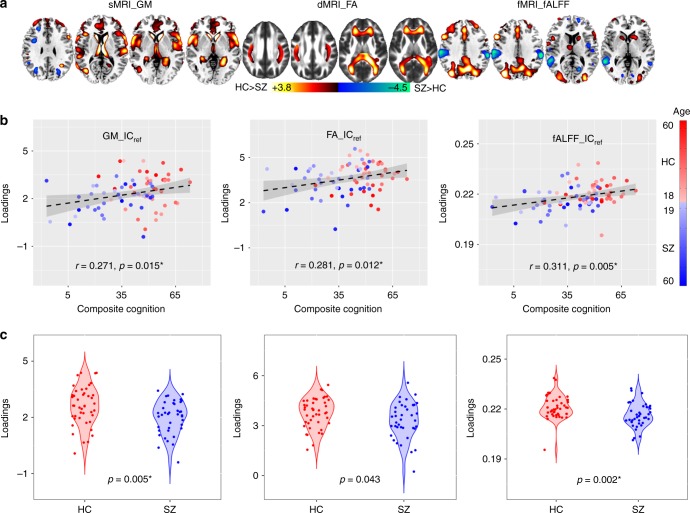
Fig. 2.
The identified joint components for UNM cohort. a The brain maps visualized at |Z| > 2; the positive values (red) means SZ < HC and the negative values (blue) means SZ > HC. b Correlations between loadings of ICref and MCCB composite scores (HC: the red dots, SZ: the blue dots); thus SZ corresponds to worse cognitive performance and lower loading weights compared to HC. c Boxplot of the loading parameters of UNM_ICref_composite that were adjusted as HC > SZ on the mean of loadings for each modality, with two sample t-tests p values between HC and SZ as shown at the bottom. The gray regions in b indicate a 95% confidence interval

