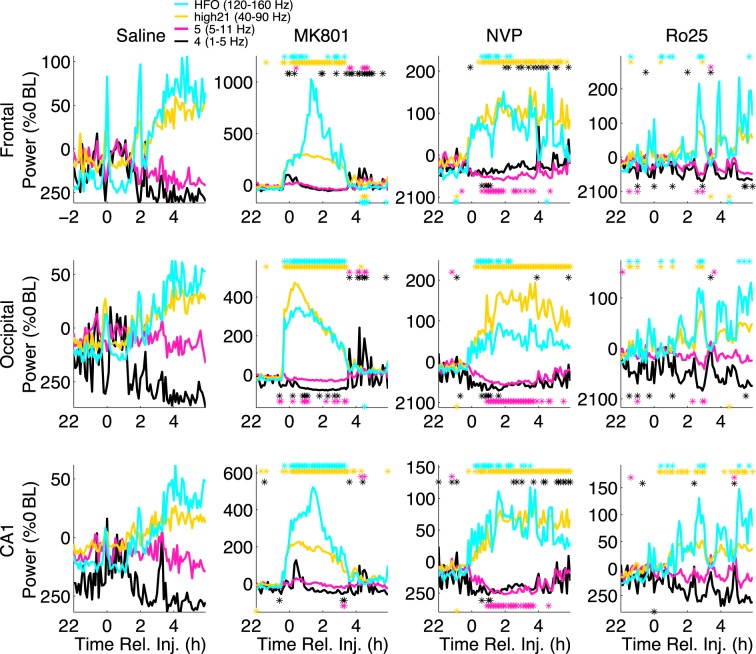
Figure 1.
NVP-AAM077 and MK-801 induce similar increases in high frequency power, but have different effects on low frequency power. Median (n = 6) spectral power (normalized as a percentage change from mean baseline power) summed over the δ (1–5 Hz), θ (5–11 Hz), high γ (40–90 Hz), and HFO (120–160 Hz) bands are shown for frontal (top), occipital (middle), and CA1 (bottom) electrodes, following saline (left), MK-801 (middle left), NVP-AAM077 (middle right), and Ro25–6985 (right) injection. Stars indicate 6 min periods for which spectral power is significantly higher (above) or lower (below) than saline (ranksum test, significance level = 0.05).

