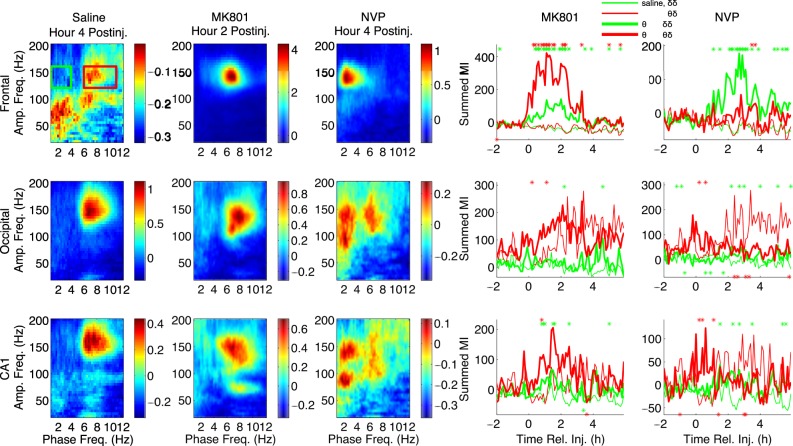
Figure 2.
Patterns of phase-amplitude coupling following MK-801 and NVP-AAM077 injection differ markedly. In the left three columns, median (n = 6) comodulograms for the h of largest effect are shown for simultaneous LFP recordings from frontal (top row), occipital (middle row), and CA1 (bottom row) electrodes, following injection of saline, MK-801, and NVP-AAM07. These comodulograms are also shown in Figs 3 and 4 and S1; here they are shown with individually optimized color scales, to more clearly show the pattern of PAC in each region during the h of largest effect for each drug. The right two columns show timeseries of summed PAC over the θ-HFO (red rectangle and time series) and δ-HFO (green rectangle and time series) frequency ranges from 2 h pre-injection to 6 h post-injection. Thick lines are drug time series; thin lines are saline time series; stars indicate 6 min periods for which drug PAC is significantly higher (above) or lower (below) than saline (ranksum test, significance level = 0.05).

