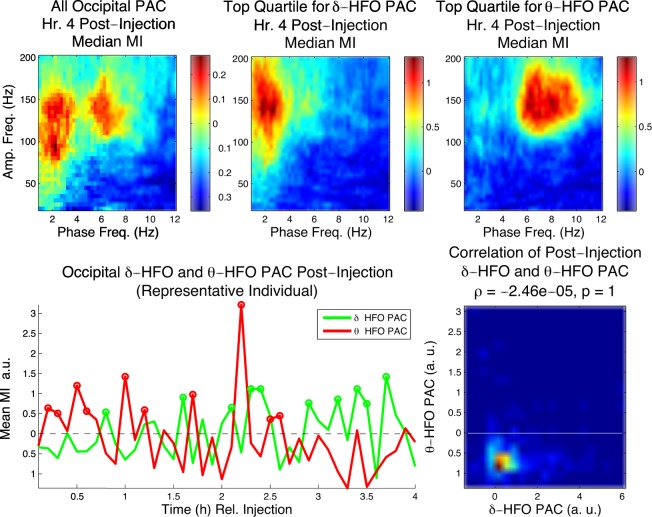
Figure 5.
δ-HFO PAC and θ-HFO PAC appear at different times in occipital cortex following NVP-AAM077 adminis- tration. Top left, the profile of median (n = 6) occipital PAC in the 4th h following NVP-AAM077 injection. Top center and right, the profiles of median (n = 6) PAC for the top quartile of epochs with respect to δ-HFO and θ-HFO PAC. Bottom left, time courses of summed δ-HFO and θ-HFO PAC for 6 min periods following injection (bottom left, representative animal, circles indicate 6 min periods in the top quartile). Bottom right, the correlation between δ-HFO PAC and θ-HFO PAC over the 4 h following injection for all animals.

