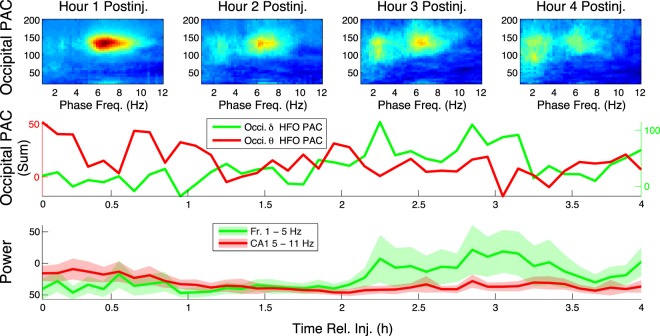
Figure 7.
The time courses of frontal δ power and CA1 θ power mirror the time courses of δ-HFO PAC and θ-HFO PAC, respectively. Top, median (n = 6) occipital comodulograms are shown for the first 4 h following NVP-AAM077 injection. Middle, profiles of median (n = 6) summed PAC (at 6 min intervals) are shown for δ-HFO and θ-HFO ranges. Bottom, mean ± s.d. (n = 6) frontal δ power (summed over 1–5 Hz) is plotted alongside median (n = 6) CA1 θ power (summed over 5–11 Hz).

