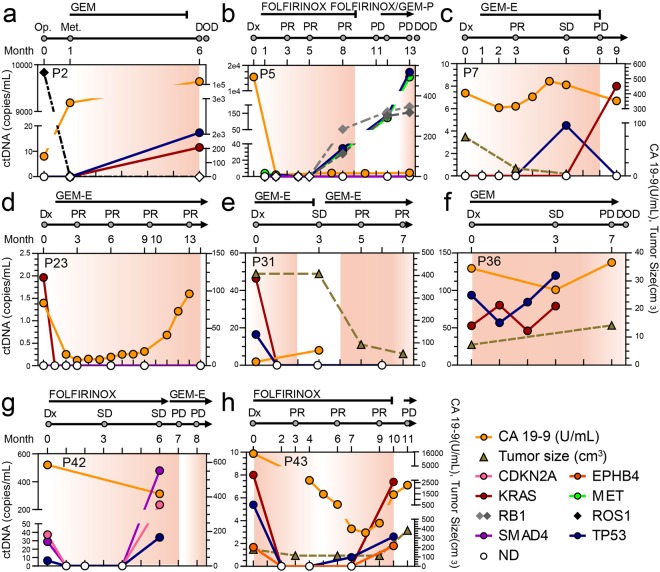
Figure 2.
Monitoring of ctDNA in pancreatic cancer patients undergoing therapeutic interventions. The ctDNA levels estimated by MP/TR were plotted on the left y-axis for eight patients (a–h). The entire list of MP/TR is summarized in Supplementary Table 6. Chemotherapeutic agents administered to each patient and therapeutic response was evaluated based on the Response Evaluation Criteria In Solid Tumors are displayed at the top of the graph. CA 19-9 level (yellow solid line) and tumor size (dark-khaki dotted line) based on CT images were plotted against the right y-axis. CCRT, concurrent chemoradiation therapy; CR, complete response; DOD, dead of disease; Dx, diagnosis; E, erlotinib; GEM, gemcitabine; FU, fluorouracil; P, cisplatin; Met, metastasis; ND, not detected; Op, operation; PD, progressive disease; PR, partial response; SD, stable disease.

