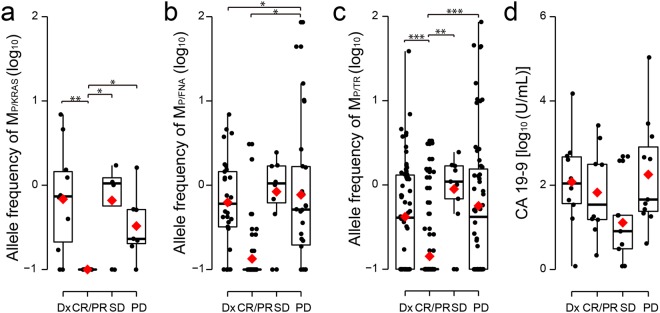
Figure 3.
Correlation of allelic frequency of ctDNA and CA19-9 levels with patient response to therapy. The allelic frequencies of (a) MP/KRAS, (b) MP/FNA, and (c) MP/TR were box-plotted based on evaluations of their near-time response to therapy and diagnosis. (d) CA 19-9 levels were box-plotted. All of the determined levels are presented on a logarithmic scale. In each box-plot, median and mean are indicated by a horizontal bar and red diamond, respectively. The level of statistical significance (ANOVA, LSD) is indicated as *P ≤ 0.05, **P ≤ 0.001, and ***P ≤ 0.00001. CR, complete response; Dx, diagnosis; PD, progressive disease; PR, partial response; SD, stable disease.

