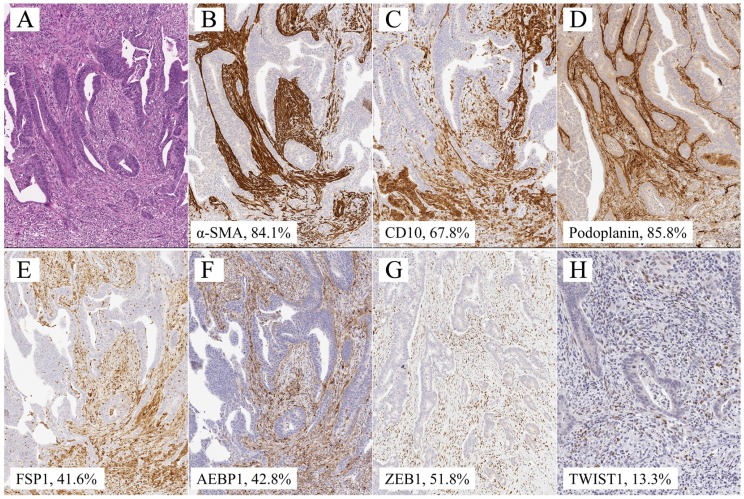
Figure 1.
Representative illustration of submucosal invasive colorectal cancer with lymph node metastasis. a. HE section. b. α-SMA staining, showing 84.1% expression. c. CD10 staining, showing 67.8% expression. d. Podoplanin staining, showing 85.8% level. e. FSP1 staining, showing 41.6% expression. f. AEBP1 staining, showing 42.8% expression. g. Zeb1 staining, showing 51.8% expression. h. Twist staining, showing 13.3% expression.

