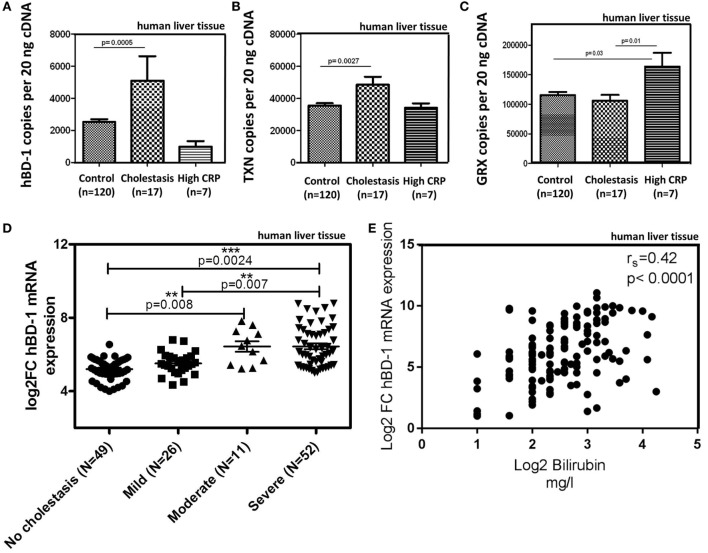
Figure 3.
hBD-1 expression in samples of patients with cholestasis. (A–C) mRNA expression of hBD-1 (A) and human oxidoreductases TXN (B) and GRX (C) were analyzed in human liver tissue (n = 144). Control group (n = 120) without cholestasis was compared with cholestatic samples (serum bilirubin > 1.2 mg/dl, mean 4.5 mg/dl) and samples with signs of systemic inflammatory response (CRP > 5 mg/l). mRNA transcript levels are measured in an amount of 20 ng cDNA. Total copy numbers are depicted. Data are presented as means ± SEM. Values between groups were considered statistically significant with p < 0.05. (D) Hepatic hBD-1 mRNA expression was assessed in a cohort of patients with different grades of cholestasis (n = 138). Depicted are scatter blots of individual hBD-1 expression with horizontal lines indicating medians. Data were analyzed by Mann–Whitney test. **p < 0.01; ***p < 0.005. (E) Correlation matrix between mRNA expression of hBD-1 and bilirubin serum values. Spearman’s rank correlation coefficient is indicated as rs. Statistical significance for comparison was p < 0.0001.

