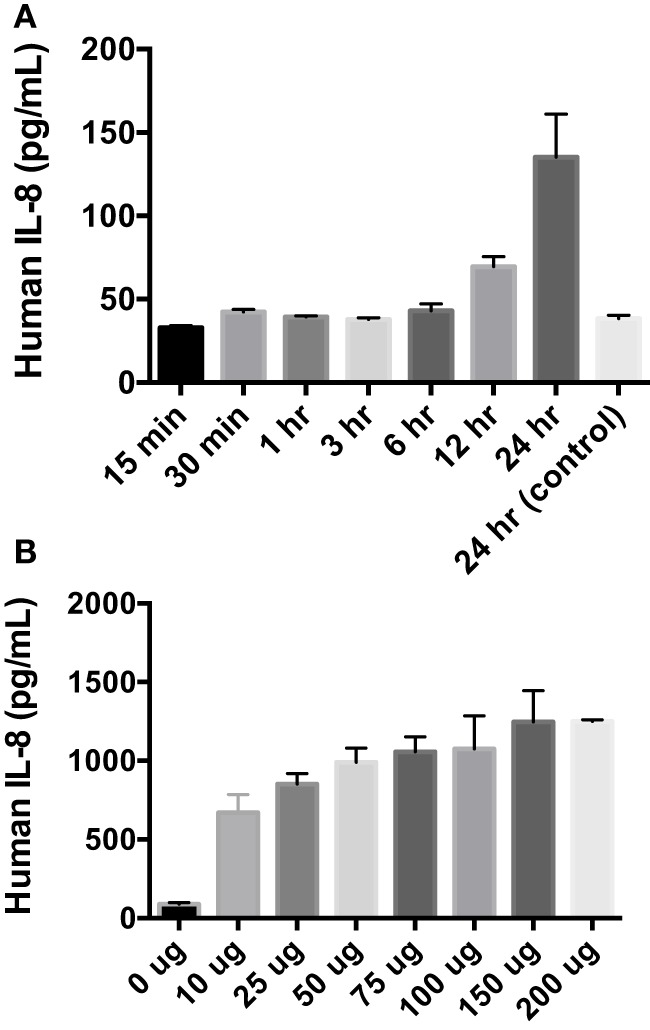
Figure 2.

Temporal and dose dependency of Alt a 1 induced IL-8 in BEAS-2B cells. (A) 2.0 × 10⁵ BEAS-2B cells were grown in RPMI + FBS + 1% Pen Strep. Cells were starved for 6 h prior to induction with rAlt a 1 or endotoxin-free sterile PBS. The starve media consisted of RPMI + 1% Pen Strep without FBS. Cells were treated with 50 µg rAlt a 1 for the specified time. Supernatants were collected and assayed via BIOLEGEND IL-8 ELISAMAX. After testing for homogeneity of variances, Tukey’s HSD was performed and adjusted (*p < 0.001). Data are represented as mean (SD). Comparisons were made between rAlt a 1 treated and untreated cells (PBS-treated 24 h control). (B) 5 × 10⁵ BEAS-2B cells were grown in RPMI + FBS + 1% Pen Strep. They were then starved for 6 h. The starve media was RPMI + 1% Pen Strep. Cells were treated with rAlt a 1 or PBS (0 μg) for 24 h. Media was collected and assayed via BIOLEGEND IL-8 ELISAMAX. Data are represented as mean (SD). Comparisons were made between Alt a 1-treated and control PBS-treated cells (*p < 0.001).
