
Figure 3.
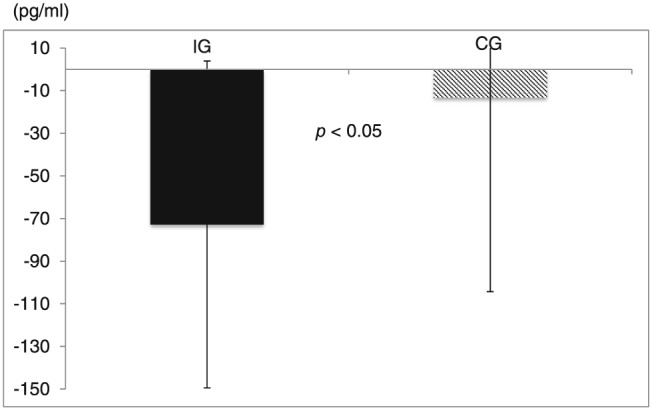
Change from initial of serum BNP levels. Probability values inside figures indicate within‐group differences. The change in serum BNP levels was significantly larger in the interventional exercise group (IG) than in the control exercise group (CG).