
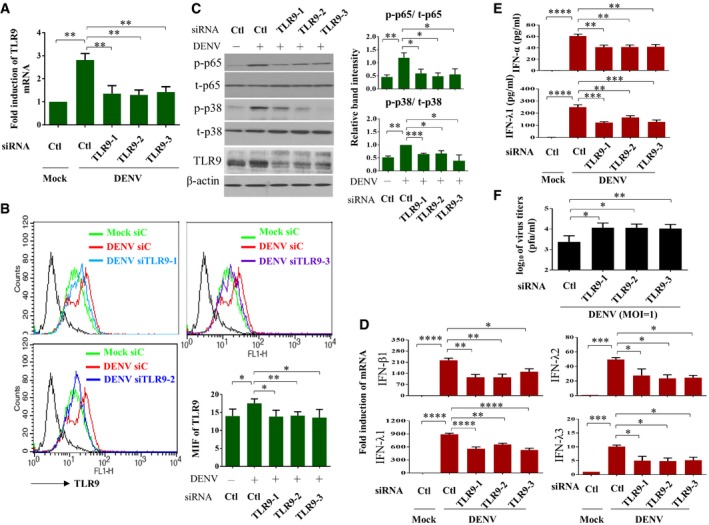
Figure 2. TLR9 activation contributed to DENV‐induced IFN production.
-
A–CHuman DCs were transfected with control siRNA (Ctl) or three sets of TLR9 siRNA duplexes for 24 h and then infected with mock or DENV (MOI = 5) for additional 24 h. The TLR9 mRNA (A, n = 3) and protein expression (B, n = 4) were determined by qPCR and flow cytometry, respectively. The levels of phosphorylated and unphosphorylated p65 (n = 5) and p38 (n = 3) and TLR9 in total cell lysates were analyzed and the relative band intensity measured (C). Values are means of individual measurements in each sample ± SEM. *P < 0.05, **P < 0.01, and ***P < 0.001 (one‐way ANOVA multiple comparisons with Bonferroni post hoc test).
-
D, EHuman DCs were transfected with control siRNA (Ctl) or three sets of TLR9 siRNA duplexes for 24 h and then infected with mock or DENV (MOI = 5) for additional 24 h. The mRNA expression of IFN‐β1, IFN‐λ1, IFN‐λ2, and IFN‐λ3 (D, n = 3) in cells and the protein levels of IFN‐α and IFN‐λ1 (E, n = 6 for IFN‐α and n = 3 for IFN‐λ1) in culture supernatants were measured. Values are means of individual measurements in each sample ± SEM. *P < 0.05, **P < 0.01, ***P < 0.001, and ****P < 0.0001 (one‐way ANOVA multiple comparisons with Bonferroni post hoc test).
-
FHuman DCs were transfected with control siRNA (Ctl) or three sets of TLR9 siRNA duplexes for 24 h and then infected with mock or DENV (MOI = 1) for additional 24 h. The virus titers in culture supernatants were measured by plaque assays (n = 4). Values are means of individual measurements in each sample ± SEM. *P < 0.05 and **P < 0.01 (unpaired, two‐tailed Student's t‐test).
Source data are available online for this figure.